Social Media has revolutionized how we consume content today. It has a huge impact on nearly every aspect of people’s lives across the globe, right from what they buy to whom they vote for. So, where did it all start? Six Degrees is the first social media platform that was founded in 1996 by Andrew Weinreic. Since then, the usage of social networking has skyrocketed exponentially.
Worldwide, there are about 5.07 billion social media users, which is roughly 62.6% of the global population, while in India, over 862 million people are on social media, constituting around 59.90% of the country’s population.
In this post, we are shedding light on the social media demographics of India and the globe.
History of Social Media Platforms in India
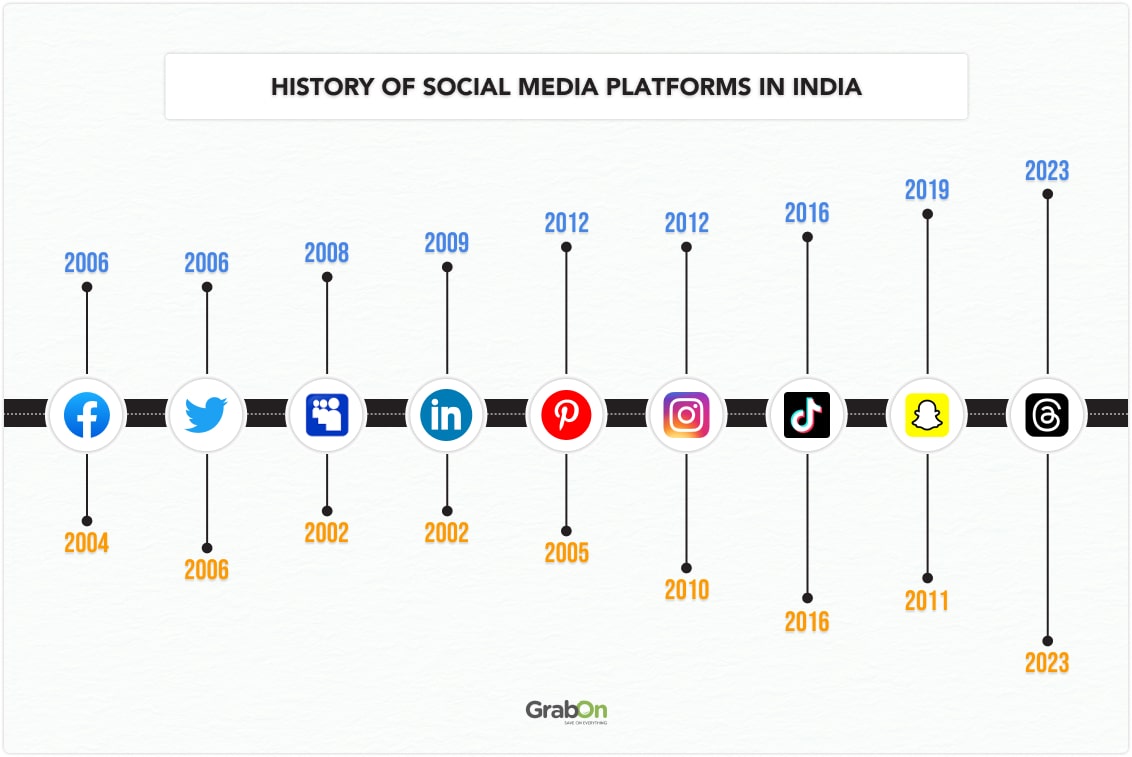
The timeline of social networking platforms is much younger than you think. Take a look at the infographic below to see which social media made its way into the Indian market in what year.
| Platform | India Launch Year | Global Launch Year |
| 2006 | 2004 | |
| 2006 | 2006 | |
| MySpace | 2008 | 2002 |
| 2009 | 2002 | |
| 2012 | 2005 | |
| 2012 | 2010 | |
| TikTok | 2016 | 2016 |
| Snapchat | 2019 | 2011 |
| Threads | 2023 | 2023 |

Top Social Media Statistics 2024 – Editor’s Picks
- There are 862 million social media users in India as of 2024.
- 59.90% of India’s population is on social media.
- An average Indian spends 150 minutes daily using social media platforms.
- There are around 68.6% male and 31.4% female social media users in India.
- WhatsApp is the most used social networking platform in India with 83% of internet users using it.
- 99% of all social media users globally access social media apps on their smartphones.
- YouTube has 462 million users in India; the highest among all the social media platforms.
How many social media users in India
India has 862.08 million social media users as of 2024, which equals 59.90% of the country’s population. India is also the country with the second-largest number of social media users in the world. China tops the list with 1.06 billion users.
Here is a table showing the countries with the most number of social media users:
| Country | Social Media Users |
| China | 1.07 billion |
| India | 862 million |
| United States | 308.3 million |
| Indonesia | 228.8 million |
| Brazil | 171.2 million |
| Russia | 118.6 million |
| Japan | 105.8 million |
| Mexico | 103.7 million |
| Philippines | 86.2 million |
| Vietnam | 74.6 million |
| Turkey | 69.5 million |
| Germany | 64 million |
| United Kingdom | 62.7 million |
Social Media Statistics in India by Year
As the Internet has reached a significant portion of the global population, a common query arises: How many people use social media? The following statistics provide an overview of total social networking app users over the years and other key factors.
- 1.24 billion people in India are on the internet as of 2024. That means 69.5% of Indian internet users also use social media.
- For the bigger picture, there are around 5.07 billion social media users in the world.
- This number is significant as 5.35 billion people around the world use the Internet. This means, that 94.7% of internet users globally already use one or the other social network.

- Interestingly, some internet user statistics in India indicate a decrease of 1.1% (5 million) in social media users from early 2023 to early 2024. Whereas, around 259 million people globally have joined social networking platforms since 2023 and this is a 5.4% annual growth.
- Reports from GWI suggest that an average social media user visits around 6.7 different social platforms every month. They also spend around 2 hours and 20 minutes daily on these platforms.
Source: DataReportal, Statista, Statista 2, Statista 3.
Social Media Statistics in India by Platform
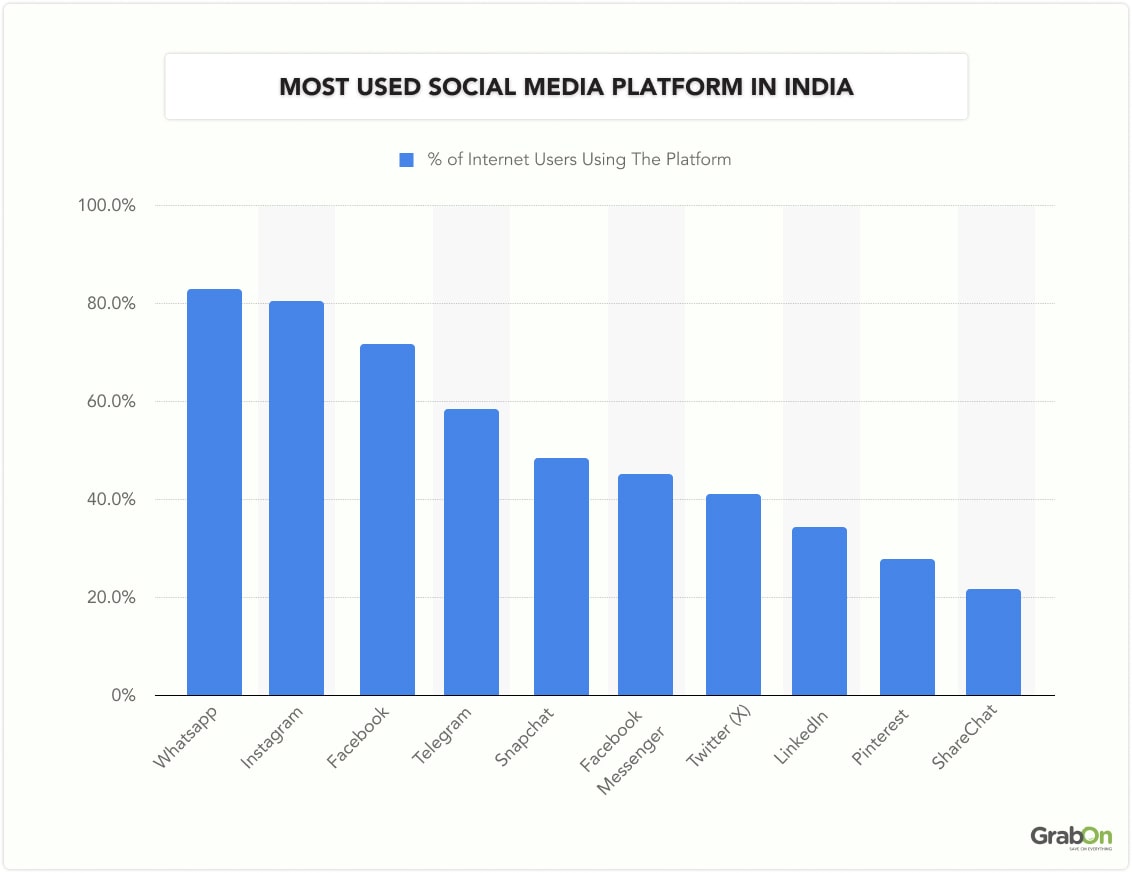
WhatsApp is the most used social media in India with 83% internet users accessing the platform. It is followed by Instagram and Facebook with 80.6% and 71.7% share respectively.
Here is a table with the most popular social media platforms in India:
| Platform Name | Share Of Indian Internet Users On The Platform |
| 83% | |
| 80.6% | |
| 71.7% | |
| Telegram | 58.4% |
| Snapchat | 48.5% |
| Facebook Messenger | 45.1% |
| Twitter (X) | 41.2% |
| 34.2% | |
| 28% | |
| ShareChat | 21.8% |

Although WhatsApp is the most popular platform, a few reports suggest that 37.9% of active social media users in India voted Instagram as their favorite social network app. WhatsApp, Facebook, and Telegram come in the 2nd, 3rd, and 4th positions on the list with 26.2%, 14.6%, and 3.9%, respectively.
YouTube Users Statistics in India
- YouTube has over 462 million users in India which is the largest in the world.
- An average Indian spends around 29 hours using the platform monthly.
- The largest user base of the platform in India is aged between 18 to 35 years.
- The user base of YouTube in India is divided into 62.2% male and 37.8% female users.
Instagram Users Statistics in India
- Instagram has 362 million users in India.
- Virat Kohli is the most followed Indian on the platform with 265 million followers.
- 44.4% of Indian users of the platform are from the 18-24 age group.
- 66.8% of Instagram’s users in India are male.
Telegram Users Statistics in India
- Telegram has around 104.04 million users in India and 900 million worldwide.
- An average Indian spends around 9 minutes and 39 seconds on the platform per visit.
- The demographics of the platform by gender are 58.09% male and 41.91% female users.
- News is the most popular channel category in Telegram.
Threads Users Statistics in India
- Thread app was most downloaded in India on the day of its launch (22%).
- The average time spent per visit on the platform by an Indian is 1 minute and 40 seconds.
- The platform’s app was downloaded 54.2 million times in India.
- Threads has gained a user base of 2 million within 2 hours of its launch.
Which state has the most social media users in India?
According to various surveys conducted in India, it was found that in states where internet penetration is high, social media usage is also high and vice versa. For example, internet penetration rates in Goa, Maharashtra, and Kerala are 73%, 69%, and 69%, respectively. Surveys indicate that these states also have a high number of social media users. In states such as Bihar, Uttar Pradesh, and Jharkhand, where internet penetration is the lowest in the country; here, social media penetration is also significantly low.
Most Used Social Media Platforms in India by Type
Nowadays, 77% of the social media users in India use instant messaging apps, like WhatsApp, Facebook Messenger, etc. In comparison, 75% of users prefer media-sharing apps like Instagram, Snapchat, YouTube, etc., followed by social networking apps, such as Facebook.
The table below shows which is the most used social media platform by type in India.
| Social Media Platform Type | No. of Social Media Users |
| Instant Messengers (Ex – WhatsApp) | 77% |
| Media Sharing (Ex – Instagram, YouTube, etc.) | 75% |
| Social Networking (Ex – Facebook) | 68% |
| Business Networking (Ex – LinkedIn) | 44% |
| Micro Blogging (Ex – Twitter) | 36% |
| Discussion Forums (Ex – Reddit) | 27% |
| Consumer Review Networking (Ex – TripAdvisor) | 18% |
| Don’t Use Social Media | 1% |
| Others | 3% |
Social Media User Demographics in India
68.6% of social media users in India are male, while 31.4% are female. This translates to approximately 599.33 million male users and 270.66 million female users.

Gender Distribution on Social Media Platforms in India: Who Uses Them More?
Social Media adoption rate by gender in India has always been in favor of male users. Leading the list, Facebook has around 74.5% male users and 25.5% female users. Whereas, Instagram and YouTube have 67.2% and 67.6% male users, respectively.
The table below illustrates the current distribution of social network users by gender across various platforms in India:
| Platform Name | Male Users (%) | Female Users (%) |
| 74.5% | 25.5% | |
| 67.2% | 32.8% | |
| YouTube | 67.6% | 32.4% |
| 70.3% | 29.7% | |
| X (Twitter) | 85.6% | 14.4% |

Source: DataReportal
Social Media Usage in India by Age
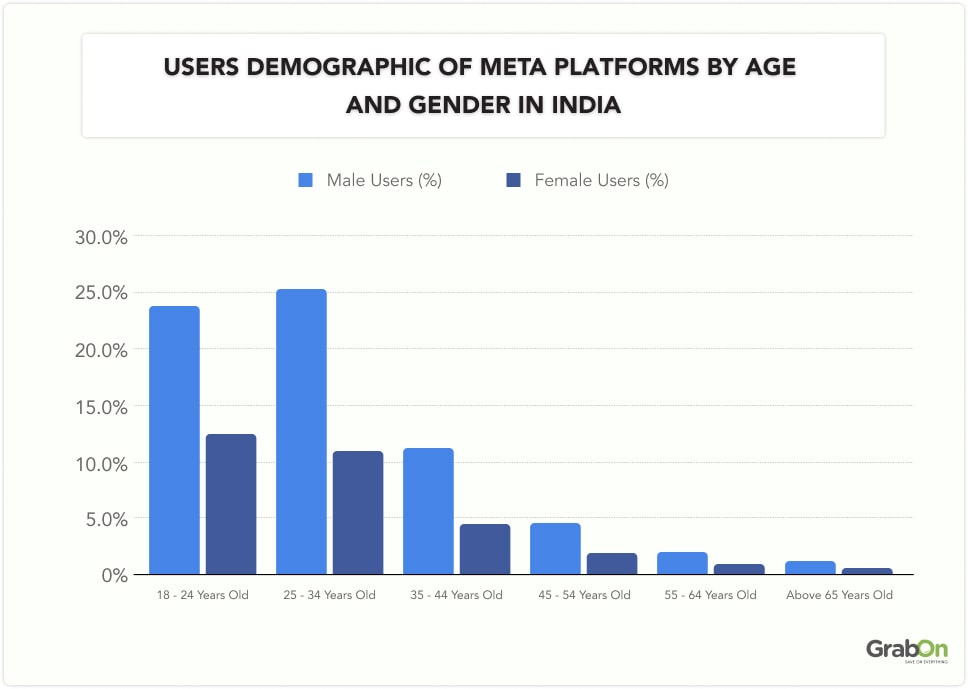
38.1% of the total population who are above 18 years old in India use social networking platforms. According to DataReportal, most users of prominent platforms, like Facebook, Instagram, and Facebook Messenger, are aged from 18 to 34 years.
This table will help you understand the user demographic of Facebook, Facebook Messenger, and Instagram by age and gender in India.
| Age Group | Male Users (%) | Female Users (%) |
| 18 – 24 Years Old | 23.9% | 12.5% |
| 25 – 34 Years Old | 25.4% | 11.1% |
| 35 – 44 Years Old | 11.3% | 4.5% |
| 45 – 54 Years Old | 4.6% | 1.9% |
| 55 – 64 Years Old | 2% | 0.9% |
| Above 65 Years Old | 1.2% | 0.6% |

Source: DataReportal
How Much Time Do Indians Spend on Different Social Media Platforms
Regarding time spent on social media apps, Indians spend around 29 hours and 8 minutes per month watching videos on YouTube. Facebook and Instagram follow the list with 23 hours, 52 minutes and 19 hours, 50 minutes, respectively.
According to Statista, as of 2024, an average Indian spends around 150 minutes (2 hours and 30 minutes) daily using social networking platforms.
The table below provides complete information about the time Indians spend on social media monthly.
| Platform | Hours Spent Per Month |
| YouTube | 29hrs 08mins |
| 23hrs 52mins | |
| 19hrs 50mins | |
| 16hrs 52mins | |
| X (Twitter) | 4hrs 15mins |
| Snapchat | 2hrs 19mins |
| Telegram | 2hrs 12mins |
| 1hr 14mins | |
| 1hr 07mins | |
| Facebook Messenger | 1hr 05mins |

Source: DataReportal, Statista
Time Spent on Social Media by Indian Youth
IIM-Rohtak conducted a study involving 38,896 youth aged 18 to 25 years to study how much time Indian youth spend on social media daily.
- The average screen time using social media apps for male users is 6 hours and 45 minutes and for female users, it is 7 hours and 5 minutes.
- The study also revealed that around 60.66% of youth use social networking apps the most during evening hours.
- Entertainment-related content leads the list of Content Preferences with 54.52% viewership. Followed by, professional and self-help content (26.23%), education, knowledge and news content (14.28%), and political content (4.97%).
- The most commonly used social media platforms among Indian Youths are Instagram (31.27%), WhatsApp (28.32%), Snapchat (19.78%), and Facebook (17.20%).
- OTT platform usage has also increased exponentially in the past few years. YouTube leads the list with around 32.03% viewership.
Source: IIM Rohtak
Time Spent on Social Media by Age in India
According to various national surveys conducted by LocalCircles in 2023, 60% of Indian youngsters (aged between 9 to 17 years) spend more than 3 hours daily using social media and gaming apps. The survey was conducted with over 46,000 responses collected from 296 districts in India.
State-wise, Maharashtra’s average is higher than India’s. 17% of parents in Maharashtra claimed that their children were using social media apps for over 6 hours daily.
The below table will show how much time Indian children (9 to 17 years age group) spend using social media and gaming apps.
| Time Spend on Social Media/Gaming Apps | % of Children |
| More than 6 hours | 15% |
| 3 to 6 hours | 46% |
| 1 to 3 hours | 39% |

Source: LocalCircles
How Does Social Media Affect Youngsters in India?
LocalCircles found out that, 39% of Indian youngsters (9 to 17 years old) feel aggressive after using social media. Other emotions shown by them are impatient (37%), lethargic (27%), etc.
Check out the below table for more information on the emotional/mental health impact of social media on Indian youngsters.
| Emotions Shown by Youngsters | % of Responses |
| Happier | 8% |
| More Social | 10% |
| Impatient | 37% |
| Aggressive | 39% |
| Depressed | 22% |
| Hyperactive | 25% |
| Lethargic | 27% |
| None of the above | 2% |
| Other Impacts | 6% |

Source: LocalCircles
Conclusion
In the above blog, we discussed about the demographic of social media users in India and worldwide. The Internet penetration rate in India is increasing rapidly every year, which is resulting in the rise of social media user base as well. We have also seen a dip in the Y-o-Y growth rate of these platforms’ user count. However, the major concerns with social media usage that need to be curbed are mental health and online fraud. Our Indian Government has taken various steps to resolve these issues, but more strict actions have to be taken in the future.


