
From its humble beginnings as an online bookstore, Amazon has evolved into the world’s largest online retailer, fundamentally changing global shopping and e-commerce practices. Amazon serves a staggering 310 million customers and hosts over 2 million active sellers globallly in 2026.
This blog post provides a comprehensive look at Amazon, highlighting key statistics such as its market share, user base, and revenue trends. Find out what makes Amazon a powerhouse in online retail and what’s driving its growth.
The latest reported figures are for Q1 2026, in which Amazon posted $181.5 billion in net sales, up 17% year over year, lifting trailing-twelve-month revenue to roughly $742.8 billion.
Amazon Statistics 2026 (Editor’s Picks)
- Amazon has 310 million active users and 9.7 million sellers worldwide.
- In Q1 2026, Amazon posted $181.5 billion in net sales, up 17% YoY, with trailing-twelve-month revenue of about $742.8 billion.
- In 2025, Amazon reported $716.9 billion in total revenue, up 12% from $638 billion in 2024.
- Amazon makes sales worth $16.3 million every second
- Amazon delivers about 1.6 million packages per day. That’s over 66,000 packages per hour and over 1,000 packages per minute.
- Amazon boasts over 250 million Amazon Prime members across 27 countries.
- Amazon ranks among the largest companies in the world by revenue, typically ranking in the top two globally behind Walmart.
Brief Overview of Amazon
| Amazon Founder | Jeff Bezos |
| Launch | July 16, 1995 |
| Headquarters | Seattle, Washington, United States |
| Valuation | $2.9 trillion |
| Industry | E-Commerce, Software Development |
Amazon leads in e-commerce market share
As of 2026, Amazon accounts for 37.6% of e-commerce sales in the US, the highest market share among all e-commerce companies. This puts it far ahead of its contenders, with Walmart at 6.4% of sales and eBay at 3%.
This growth is attributed to several factors, including the fact that 50% of consumers start their shopping journey on Amazon.
Here’s a table that shows the market share of top retail e-commerce companies in the US:
| Company | Market Share |
| Amazon | 37.6% |
| Walmart | 6.4% |
| Apple | 3.6% |
| eBay | 3% |
| Target | 1.9% |
| Home Depot | 1.9% |
| Costco | 1.5% |
| Best Buy | 1.4% |
| Carvana | 1.4% |
| Kroger | 1.3% |
Over 350 million products are sold on the Amazon Marketplace
Amazon offers a vast selection of over 350 million products, including those from third-party sellers. Additionally, Amazon sells more than 12 million products by itself.
Most popular Amazon categories among sellers
The top categories for Amazon sellers are home and kitchen, beauty and personal care, clothing, shoes, and jewelry.
Categories like Home & Kitchen and Beauty & Personal Care lead due to their broad appeal and consistent consumer spending, making shopping at Amazon a preferred choice for diverse needs.
To understand where Amazon sellers focus their efforts, here are the top categories based on their popularity:
| Amazon Category | Share of Sellers |
| Home & Kitchen | 35% |
| Beauty & Personal Care | 26% |
| Clothing, Shoes & Jewelry | 20% |
| Toys & games | 18% |
| Health, Household & Baby Care | 17% |
| Baby | 16% |
| Electronics | 16% |
| Sports & Outdoors | 16% |
| Pet Supplies | 13% |
| Office Supplies | 13% |
Source: ECDB
Why This Matters
These percentages indicate the proportion of Amazon sellers operating within each category, highlighting where seller focus and consumer demand intersect most prominently. Categories like Home & Kitchen and Beauty & Personal Care lead due to their broad appeal and consistent consumer spending.
How many people shop on Amazon?
As of 2026, Amazon has over 310 million active users globally. More than 80% of these users are from the United States, accounting for over 230 million customers.
As many as 25% of Americans use Amazon for shopping at least once a week
As for what Americans are buying on Amazon, electronics and tech is the most popular category, with 55% of Americans shopping for these items on the site.
Other popular purchase categories include clothing and accessories (48%), toiletries and personal care items (42%), and kitchen and household essentials (41%).
Here’s a table that shows Amazon’s (.com) traffic from various countries:
| Country | Traffic Share |
| United States | 80% |
| India | 1.87% |
| Canada | 1.30% |
| United Kingdom | 1.18% |
| Japan | 0.97% |
Source: SimilarWeb
How many Amazon sellers are there?
Amazon has over 9.7 million registered sellers globally, of which more than 2 million are actively selling on Amazon in 2026.
Over 60% of sales in Amazon’s stores come from third-party or independent sellers, most of whom represent small and medium-sized businesses. Independent sellers in the U.S. sold more than 4.5 billion items, an average of 8,600 every minute
Business owners choose to sell on Amazon due to the exceptional value it offers. They gain access to a large customer base, powerful tools, services, and programs that can fuel their business growth, often at a lower cost than other alternatives.
Amazon ships close to 1.6 million packages each day
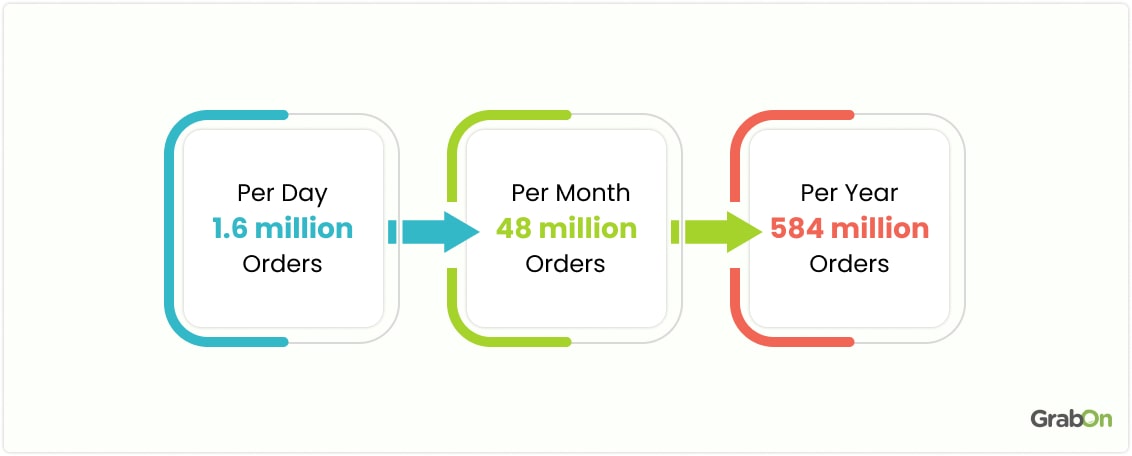
Amazon ships approximately 1.6 million orders per day, which translates to 66,000 orders per hour or over 1,000 orders per minute. That’s an impressive volume of packages moving through their system.
| Time Period | Orders |
| Per Day | 1.6 million |
| Per Month | 48 million |
| Per Year | 584 million |
Amazon delivered over 13 billion items the same or next day in 2025
In 2025, Amazon set a new Prime delivery speed record, with more than 13 billion items arriving the same or next day worldwide, an over 30% increase compared to last year.
This new record highlights how fast the company’s logistics network has scaled, making fast delivery a standard expectation for millions of customers across global markets.
Prime members saved $105 billion on delivery in 2025
Amazon reported that Prime members saved about $105 billion worldwide in 2025 on fast, free delivery.
In the US, members saved an average of around $550 each, nearly four times the cost of an annual membership, showing how heavily frequent shoppers benefit from the membership over the course of a year.
Amazon makes nearly $2 billion in sales a day
With $716.9 billion in total revenue in 2025, Amazon averaged nearly $2 billion in revenue per day when spread across the year. That daily figure shows just how large the company’s operations have become, with steady growth continuing year after year.
Based on Amazon’s Q1 2026 revenue run rate of approximately $181.5 billion per quarter, the company is currently generating around $2 billion in sales per day too, which works out to nearly $23,000 in revenue every second.
How much revenue does Amazon make?
As of Q1 2026, Amazon has registered a revenue figure of $181.5 billion.
In 2025, Amazon reported $155.7 billion in Q1, $167.7 billion in Q2, and $180.2 billion in Q3, bringing its revenue to $503.6 billion by the end of the third quarter. Each of these quarters grew roughly 9% to 13% year over year compared to 2024.
Q4 2025 revenue came in at about $213.4 billion, pushing Amazon’s total revenue for 2025 to $716.9 billion. This continued the company’s steady growth trend, up from $638.0 billion in total revenue in 2024.
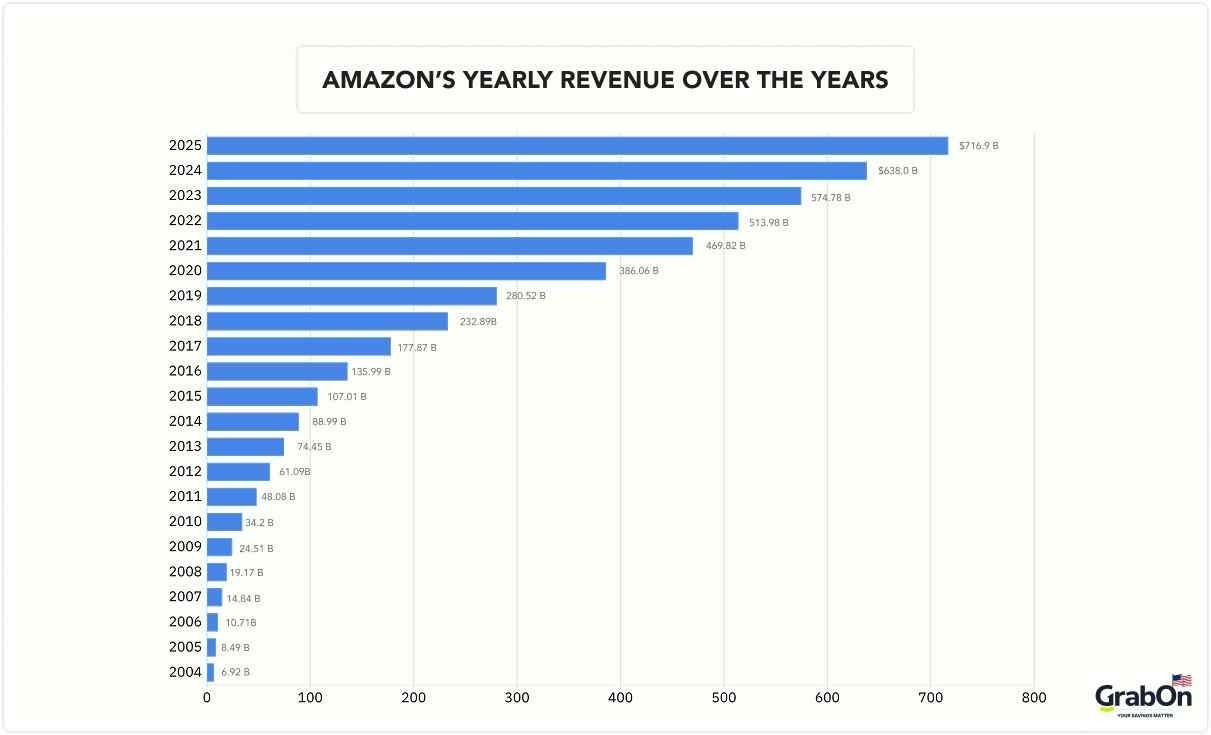
Here’s a table showing Amazon’s yearly revenue over the years:
| Year | Annual Revenue (in USD) |
| 2026 (As of Q1) | $181.5 billion |
| 2025 | $716.9 billion |
| 2024 | $638.0 billion |
| 2023 | 574.78 billion |
| 2022 | 513.98 billion |
| 2021 | 469.82 billion |
| 2020 | 386.06 billion |
| 2019 | 280.52 billion |
| 2018 | 232.89 billion |
| 2017 | 177.87 billion |
| 2016 | 135.99 billion |
| 2015 | 107.01 billion |
| 2014 | 88.99 billion |
| 2013 | 74.45 billion |
| 2012 | 61.09 billion |
| 2011 | 48.08 billion |
| 2010 | 34.2 billion |
| 2009 | 24.51 billion |
| 2008 | 19.17 billion |
| 2007 | 14.84 billion |
| 2006 | 10.71 billion |
| 2005 | 8.49 billion |
| 2004 | 6.92 billion |
Source: Amazon
Amazon Revenue By Segment in Q1 2026
Amazon’s net sales in Q1 2026 rose 17% year over year to $181.5 billion, the fastest quarterly growth rate in years, beating analyst expectations of about $177.2 billion.
AWS was the standout: cloud revenue grew 28% to $37.6 billion, its fastest pace in 15 quarters, on the back of surging AI demand. North America grew 12% to $104.1 billion and International grew 19% to $39.8 billion.
Here is the breakdown
| Q1 2026 Segment | Revenue | YoY Growth | Op. Income |
| North America | $104.1 billion | +12% | $8.3 billion |
| International | $39.8 billion | +19% | $1.4 billion |
| AWS (Cloud) | $37.6 billion | +28% | $14.2 billion |
| Total | $181.5 billion | +17% | $23.9 billion |
Source: Amazon Q1 2026 results (8-K, April 29, 2026).
Amazon Revenue By Segment 2025
Amazon’s total 2025 revenue reached $716.9 billion, with diversified growth across segments led by North America, AWS, and third-party services.
Here’s a simple breakdown by major business:
| Business Area | Revenue | % of Total | YoY Growth |
| North America Sales | $392.1 billion | 54.7% | +11% |
| International Sales | $145.2 billion | 20.3% | +13% |
| AWS (Cloud) | $115.8 billion | 16.2% | +17% |
| Advertising | $62.1 billion | 8.7% | +14% |
| Prime Subscriptions | $48.5 billion | 6.8% | +12% |
| Physical Stores | $22.8 billion | 3.2% | +8% |
Source: Amazon
Amazon Prime Statistics
One of the main factors contributing to Amazon’s success is its subscription service, Amazon Prime, which provides free and fast delivery, exclusive discounts, and more.
Let’s look at some key statistics that highlight the impact of Amazon Prime on the e-commerce industry.
Amazon has over 250 million Prime members around the world
There are over 250 million Amazon Prime members worldwide with 25 million in India and 200 million in the US. alone.
The average Prime subscriber spends about $1,400 dollars a year.
Amazon Prime Day 2025 became the largest event on record with $24.1 billion in sales
In 2025, Amazon Prime Day drove $24.1 billion in US online spending, making it the largest Prime Day event on record in the US.
The four-day sale ran from July 8 to July 11 and exceeded Adobe’s pre-Prime Day estimate of $23.8 billion. It also generated more spending than two Black Fridays combined.
Prime members bought a record number of items during the event, with independent sellers hitting their highest Prime Day sales ever.
Office supplies led the way with 105% growth, while electronics rose 95% and books increased 81%.
Mobile shopping and BNPL usage surged during Prime Day 2025
Mobile shopping played a major role, accounting for 53.2% of total spend, or about $12.8 billion. Buy Now, Pay Later usage also climbed sharply, up 33% year over year to $2 billion in spending.
Popular items included Premier Protein Shakes, Dawn Powerwash, and the Amazon Fire TV Stick, while categories like electronics, toys, and appliances led overall sales.
Amazon also reported record-breaking item sales and billions in customer savings, supported by AI-powered tools such as Rufus and Alexa+.
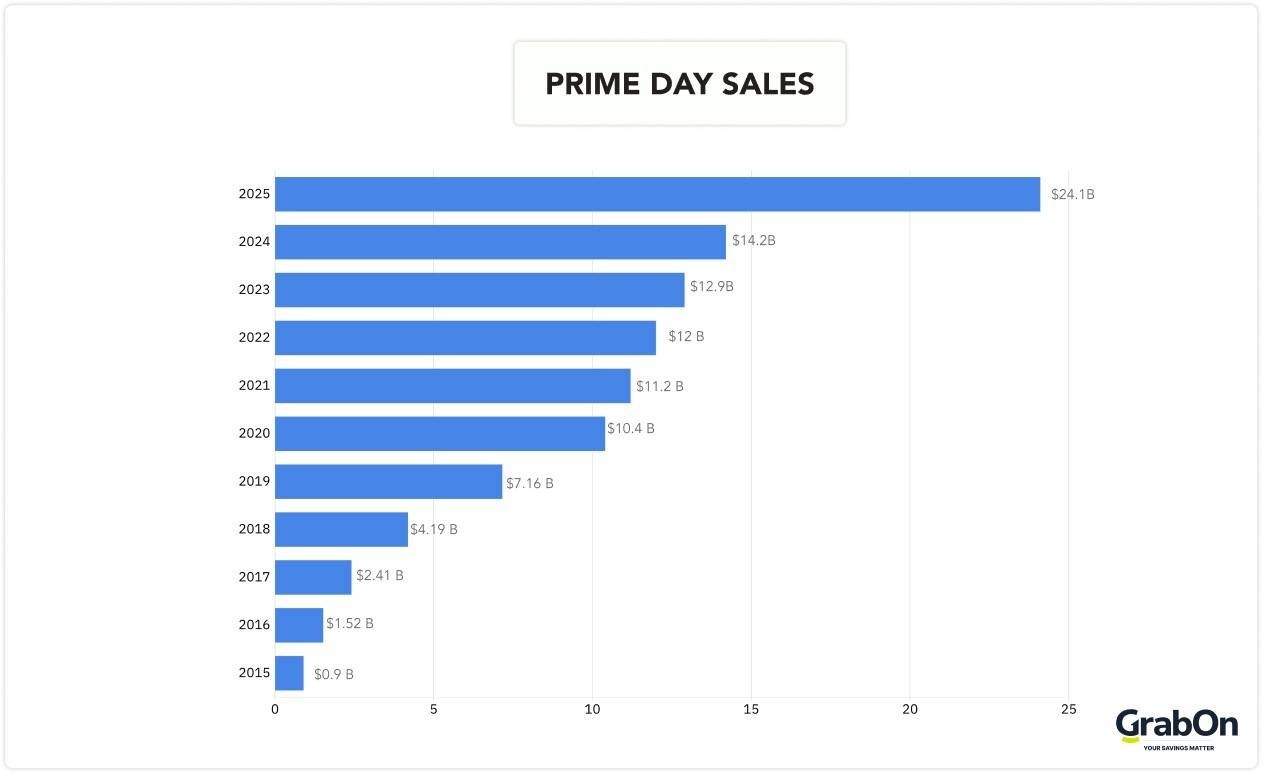
The table below shows Amazon Prime Day sales by year, highlighting how the event has grown over time.
| Year | Prime Day Sales |
| 2025 | $24.1 billion |
| 2024 | $14.2 billion |
| 2023 | $12.9 billion |
| 2022 | $12 billion |
| 2021 | $11.2 billion |
| 2020 | $10.4 billion |
| 2019 | $7.16 billion |
| 2018 | $4.19 billion |
| 2017 | $2.41 billion |
| 2016 | $1.52 billion |
| 2015 | $0.9 billion |
Source: Statista
Revenue from Prime Membership Services
Amazon generated $49 billion in revenue through its Prime subscriptions in 2025.
Amazon Prime Video is the second-largest streaming service globally
As of 2026, Amazon’s premium video service has a massive global presence with more than 200 million monthly viewers. It ranks second to Netflix, which has over 269.6 million viewers.
Prime Video is available in more than 200 countries and regions around the globe.
Wrapping Up
In 2026, Amazon’s dominant position in global e-commerce is undeniable. With a customer base of over 310 million and a significant 37.6% share of e-commerce sales in the US, Amazon continues to set the standard for online retail.
In the future, Amazon’s investments in technology and delivery are expected to make it work better and give customers a better experience. As people change how they buy things and more things are sold online, Amazon’s ability to adjust and innovate will be key to staying ahead.