
India’s online shopping story has quietly changed. The metros that once defined e-commerce growth are now the slower-growing half of the market, while Surat, Indore, Jaipur, Coimbatore, and hundreds of towns like them supply the new shoppers, the new sellers, and an increasing share of the spend.
The numbers below track exactly how big that shift has become in 2026, and what it means for where India’s next ₹10 lakh crore of online spending will come from.
Top Picks: Key Stats for 2026
- Close to 55% of India’s new luxury shoppers now live in tier-2 and tier-3 cities.
- Quick commerce has moved past its metro-only phase and now reaches more than 80 tier-2 and tier-3 cities.
- Tier-2 and tier-3 cities together account for 53% of India’s outbound travel currency demand in 2026.
- India’s e-retail market crossed ₹5.6 lakh crore in GMV in 2025, with tier-2+ cities supplying close to half the new orders.
What Is the Tier-2 and Tier-3 Online Shopping Market Size in 2026?
India’s overall e-retail gross merchandise value reached $65-66 billion in 2025, translating to roughly ₹5.6-5.7 lakh crore at prevailing exchange rates. Tier-2 and tier-3 cities are no longer a side market within that number; they are the reason the number keeps climbing.
Total e-retail GMV: ₹5.6-5.7 lakh crore in 2025, on pace to reach ₹14.8-15.7 lakh crore by 2030
- Tier-2+ cities contributed close to 50% of India’s incremental e-retail orders in 2025, even though shopper penetration there sits at just 25-30% of internet users, compared with 45-50% in metro and tier-1 markets.
- KPMG projects tier-2 and smaller cities will account for 88% of new online shoppers added between 2020 and 2030, with e-retail GMV reaching ₹15-16 lakh crore by the end of the decade.
- The broader e-commerce market, measured on McKinsey’s wider definition that includes D2C and social commerce, stood at $70-80 billion (₹6.1-7 lakh crore) in 2024 and is projected to hit $180-200 billion (₹15.7-17.4 lakh crore) by 2030.
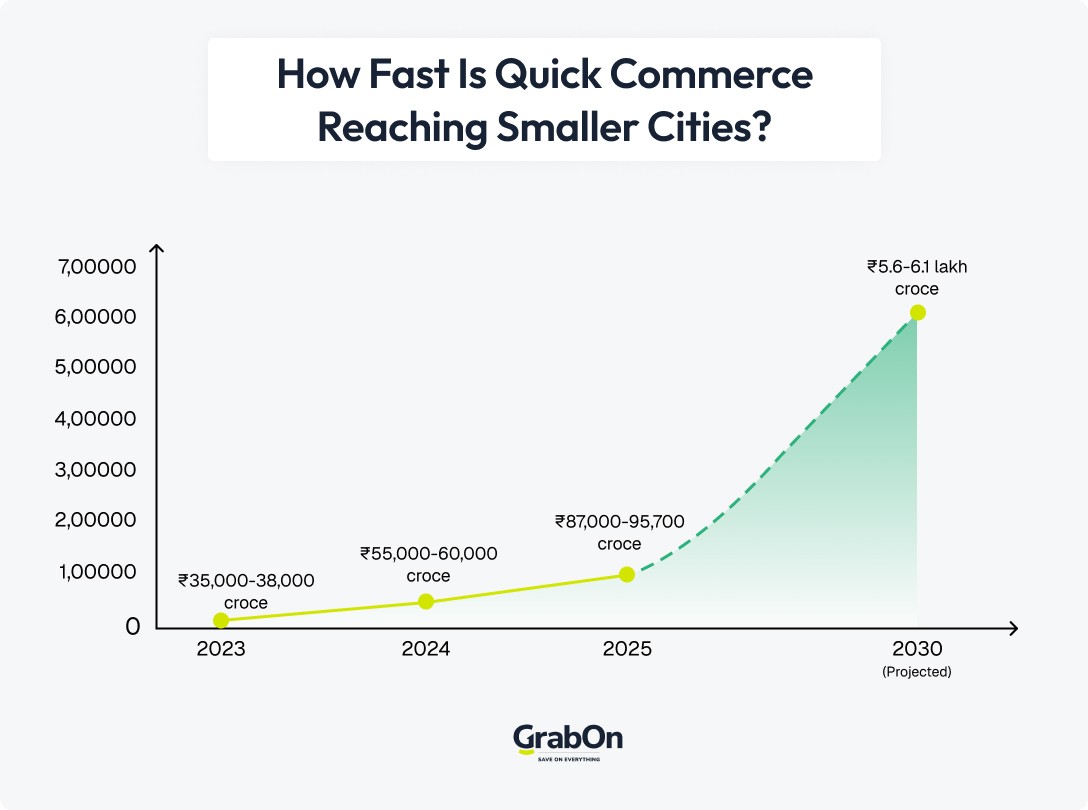
- Quick commerce alone, still a relatively young format, generated ₹87,000-95,700 crore in GMV in 2025.
Tier-2+ cities have barely a quarter of their internet users shopping online, yet they already generate half the new orders. That is not saturation catching up; it is a market still in its early innings producing outsized growth off a small base, which is exactly why every major platform is now building tier-2 and tier-3 specific strategies.
(Sources: Bain & Company, KPMG, McKinsey & Company)
Online Shopping Growth by City Tier
| City Tier | Shopper Penetration (% of internet users) | Key Drivers |
| Metro / Tier-1 | 45-50% | Speed and instant gratification, higher average order value, willingness to pay a premium for quick delivery |
| Tier-2 | 25-30% (contributing over 50% of incremental orders) | Deals and discount-seeking, rapid digital payment adoption, rising disposable incomes |
| Tier-3 | Lower base than tier-2, fastest year-on-year growth | Cash-on-delivery preference, price sensitivity, growing smartphone and voice/vernacular access |
(Sources: Bain & Company, PwC)
Budget and Spend Breakdown by Category
Understanding where tier-2 and tier-3 rupees actually go matters more than the headline market size, since category mix differs sharply from metro spending patterns.
| Category | Share of E-Commerce Order Value | Estimated Spend (on ₹5.6-5.7 lakh crore base) |
| Apparel and electronics (combined) | Over 70% | ₹3.9-4 lakh crore |
| Quick commerce essentials (grocery, FMCG, personal care) | 16-17% of e-retail GMV, of which 85-90% is household essentials | ₹85,000-95,000 crore |
| D2C and social commerce channels | New spend of ₹87,000-1,04,400 crore in 2025 | ₹87,000-1,04,400 crore |
| Beauty, home, and general merchandise | Remaining balance of order value | Balance of total GMV |
Key insight: Apparel and electronics are the fixed backbone of tier-2/3 spend; they dominate order value regardless of season, while quick commerce essentials are the variable, habit-forming layer that platforms use to keep shoppers checking in daily. The D2C section is growing fastest in relative terms, since it lets small brands reach smaller cities without the cost of a physical store network.
(Sources: GoKwik, Bain & Company, McKinsey & Company)
Metro Shoppers vs Tier-2/3 Shoppers
| Comparison Point | Metro / Tier-1 Shoppers | Tier-2/3 Shoppers |
| Core motivation | Speed, convenience, instant gratification | Best deals and discounts |
| Preferred payment | UPI and cards, comparable acceptance to metros | UPI plus significant cash-on-delivery to limit fraud risk |
| Category focus | Electronics, quick commerce, premium fashion | Ethnic wear, occasion wear, value electronics |
| Trust barrier | Lower, established platform familiarity | Fake reviews deter over 42% of shoppers in health and wellness purchases |
| Growth trajectory | Mature, slower incremental growth | Fastest-growing cohort, driving ~50% of new orders |
| App vs website usage | Mixed | Over 60% prefer shopping via apps |
The trust gap is the more interesting number here than the deal-seeking one. Tier-2 and tier-3 shoppers are not simply price-sensitive versions of metro shoppers; they are operating with less established purchase confidence, which is why cash-on-delivery persists even where UPI is fully available.
(Sources: PwC India)
How Do Tier-2 and Tier-3 Shoppers Pay for Their Purchases?
Digital payments have grown faster in smaller cities than almost anywhere else in the country, even as cash-on-delivery holds its ground as a trust mechanism rather than a habit.
- UPI processed 23.66 billion transactions in July 2026, worth close to ₹30 lakh crore, a 22% year-on-year rise in volume.
- 86% of all UPI transactions fall in the ₹0-500 range, reflecting everyday, low-value purchases rather than big-ticket spending, a pattern especially pronounced outside metros.
- The RBI’s Payments Infrastructure Development Fund has deployed 4.77 crore digital touchpoints, with incentives specifically targeted at tier-3 to tier-6 cities.
- Cash-on-delivery remains the preferred option for a meaningful share of tier-2/3 shoppers, chosen to minimise fraud risk rather than out of unfamiliarity with digital payments.
- Generation X shoppers in these markets show a distinct preference for card transactions on mid-to-high value purchases, citing transaction safety as the deciding factor.
Are MSMEs Driving Tier-2 and Tier-3 E-Commerce?
- India’s 60 million MSMEs contribute nearly 30% of GDP, worth close to ₹87 lakh crore annually, and around half of registered small enterprises are located in tier-2 and tier-3 cities.
- MSMEs are projected to drive around half of India’s e-commerce growth through 2030.
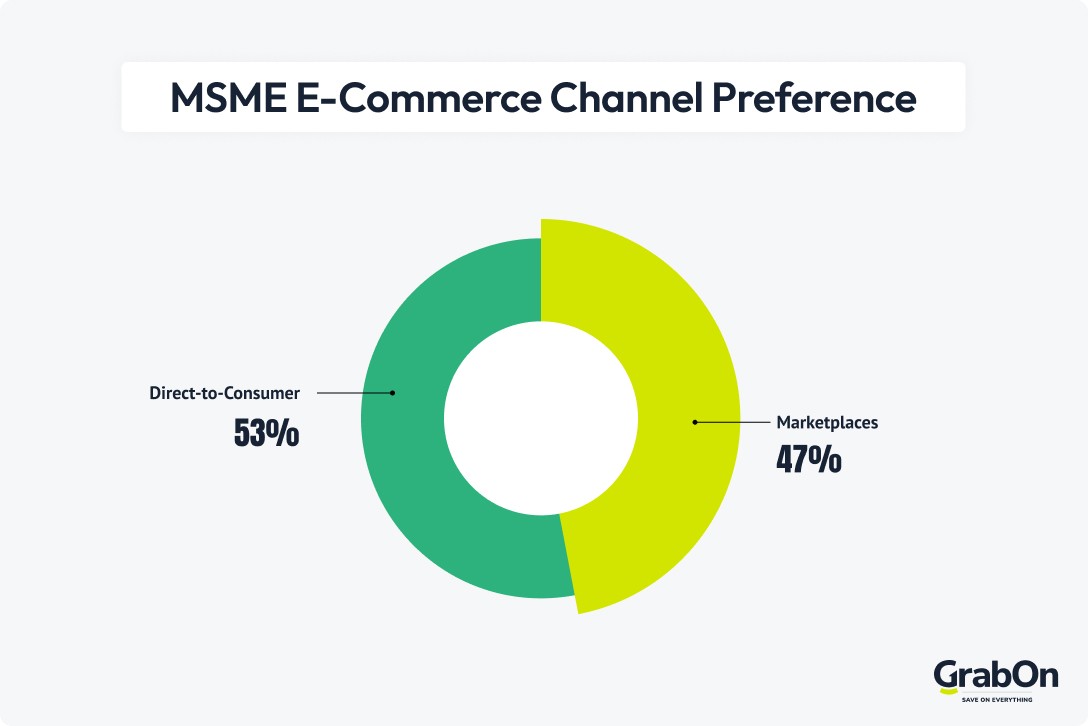
- In a McKinsey survey of over 1,000 Indian MSMEs, 53% said they prefer direct-to-consumer channels (social storefronts, independent websites, WhatsApp and Telegram groups) over marketplace listings, against 47% favouring marketplaces.
- India’s D2C channel is expected to grow from ₹87,000-1,04,400 crore in 2025 to ₹4.8-5.2 lakh crore by 2030, close to three times faster than traditional marketplace growth.
- The market for modular, unbundled digital commerce tools built specifically for MSMEs is estimated at $25-30 billion (₹2.2-2.6 lakh crore) by 2030.
(Source: McKinsey & Company)
How Fast Is Quick Commerce Reaching Smaller Cities?
Quick commerce built its reputation in metro pincodes, but its next phase of growth is explicitly a tier-2/3 story.
- Quick commerce GMV has doubled annually since 2023, reaching ₹87,000-95,700 crore in 2025, and is projected to scale to ₹5.6-6.1 lakh crore by 2030.
- Platforms have expanded their micro-fulfillment network to over 7,000 centres across more than 200 cities, though two-thirds of new centres still concentrate in the top 10 cities.
- Household essentials (groceries, personal care, FMCG) make up 85-90% of quick commerce GMV, positioning the format as a convenience channel first and a discretionary channel second.
- Q-commerce players have entered more than 80 tier-2 and tier-3 cities, cutting delivery times and exposing smaller-city consumers to a wider variety of brands than local retail could offer.
- Customer adoption and unit economics beyond top metros and tier-1 cities remain unproven, even as expansion continues.
(Source: Bain & Company)
What Role Does Travel and Forex Spending Play in the Tier-2/3 Story?
Online shopping is not the only category showing this shift, and the parallel data from travel spending makes the underlying trend harder to dismiss as sector-specific noise.
- Tier-2 and tier-3 cities together account for 53% of India’s outbound forex demand in the year through March 2026, against 47% from tier-1 cities and metros.
- Tier-2 cities alone contribute 41% of forex demand, with tier-3 cities adding another 12%.
- Leisure travel drives 57% of total forex demand, ahead of corporate travel at 27% and student travel at 16%.
- Consumers aged 25-40 account for the largest share of forex usage at 37%, followed closely by the 41-60 age group at 36%.
- Digital forex adoption grew 25% year-on-year, with self-service digital platform usage up 50% over two years.
(Source: Thomas Cook India Forex Report 2026)
What’s Next for Tier-2 and Tier-3 Online Shopping?
India’s e-retail market is projected to sustain more than 20% annual growth through 2030, scaling from ₹5.6-5.7 lakh crore today to ₹14.8-17.4 lakh crore, depending on which analyst’s category definition is used. Three sub-trends will decide how much of that growth lands in tier-2 and tier-3 cities specifically.
Geographic expansion of fulfillment networks. Quick commerce and D2C logistics are pushing further into towns beyond the top 200 cities, but profitability at that scale is still unproven, meaning the next wave of expansion will be more selective and data-driven than the land-grab phase of 2022-2024.
AI and conversational commerce are normalising outside metros. India is already the world’s second-largest ChatGPT market, with over 160 million monthly active users, growing 4.5 times in 2025 alone. As e-retailer-led assistants and LLM-led shopping agents mature, tier-2/3 shoppers who currently rely on video and vernacular discovery are well positioned to adopt conversational shopping quickly.
A values-driven shift toward premiumisation. Redseer data shows tier-2+ per-shopper festive spending climbing even as new-shopper acquisition slows, and nearly 55% of new luxury shoppers now come from tier-2 and tier-3 cities. Growth in these markets is increasingly about spending more per shopper on better products, not just adding new, price-sensitive shoppers.
Conclusion
India’s e-retail market, worth ₹5.6-5.7 lakh crore in 2025, is expected to reach ₹14.8-17.4 lakh crore by 2030. Tier-2 and tier-3 cities already drive roughly half of the country’s new online orders, over half of its new luxury shoppers, and 53% of its outbound forex demand, while their MSMEs generate close to ₹87 lakh crore a year and increasingly favour direct-to-consumer channels over marketplaces. Shoppers in these cities have moved past cautious, deal-only buying. They now spend confidently and are paying more per order for better products.