
Indian households spent ₹49,686 billion in the first quarter of 2026, nearly 60% of the country’s GDP. What’s changed is where that money is going: for the first time, non-food spending dominates both urban (60.83%) and rural (53.62%) budgets.
The long-standing gap between rural and urban spending has reduced to its lowest point on record. Both regions saw per capita spending grow 8-9%, but rural India is now closing the distance faster than ever.
This blog covers the rural-urban spending gap, category-wise budget shares, state-level differences, income-class patterns, and what’s projected through 2028.
Top Picks: Indian Consumer Spending Statistics (2026)
- Urban India’s monthly per capita expenditure is ₹6,996; rural India’s is ₹4,122.
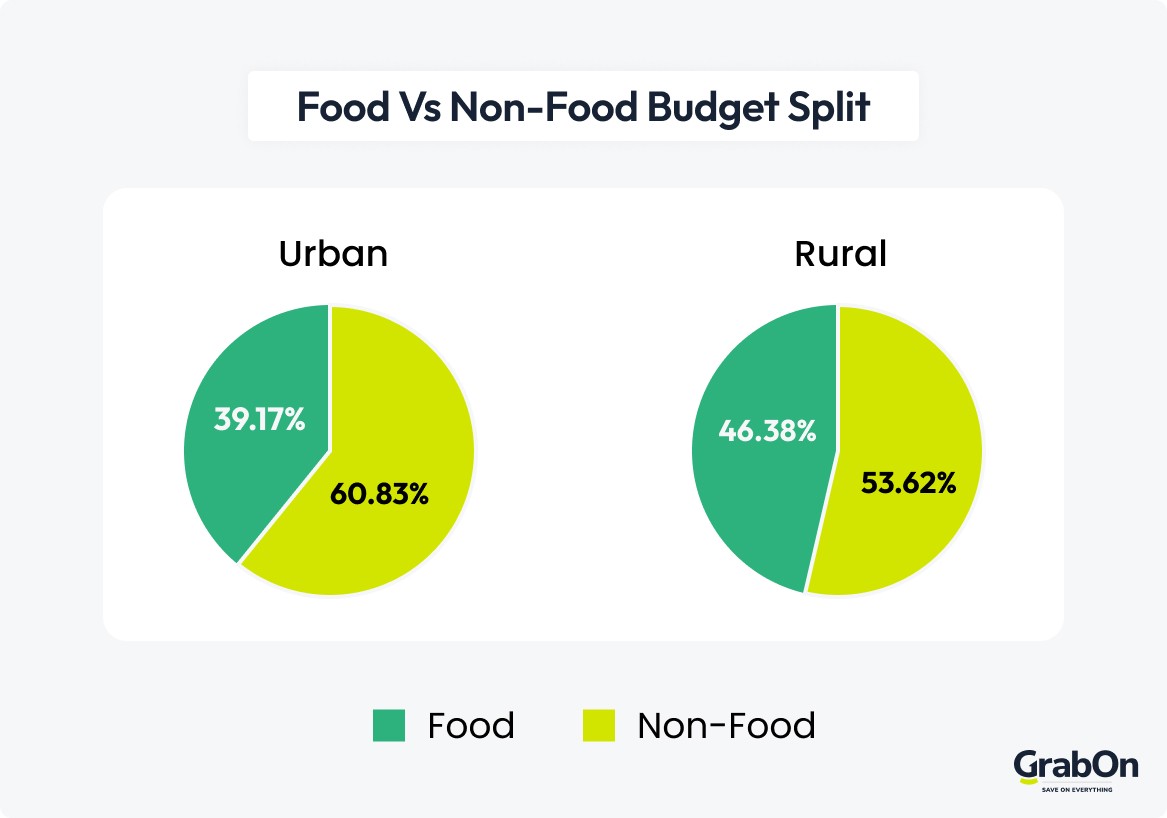
- Non-food spending is 60.83% of urban household budgets and 53.62% of rural household budgets.
- India spent ₹49,686 billion on consumption in the first quarter of 2026.
- RBI reported a Future Expectations Index of 123.4 points in early 2026. This shows strong long-term consumer optimism despite immediate-term inflationary pressures.
- The urban-rural consumption gap narrowed to 69.8%, down from 84% in 2011-12.
What is the Average Indian Household Expenditure in 2026
The Monthly Per Capita Consumption Expenditure (MPCE) shows how much people in India spend on goods and services each month. It includes everyday expenses such as food, utilities, household items, and entertainment.
- Urban India spends ₹6,996 per person a month out of pocket, covering everything from groceries to rent to phone bills.
Add the market value of free government benefits, like food grains and subsidized healthcare, that households receive but don’t pay for, and the total comes to ₹7,078. This shows what households actually consume, not just what they spend.
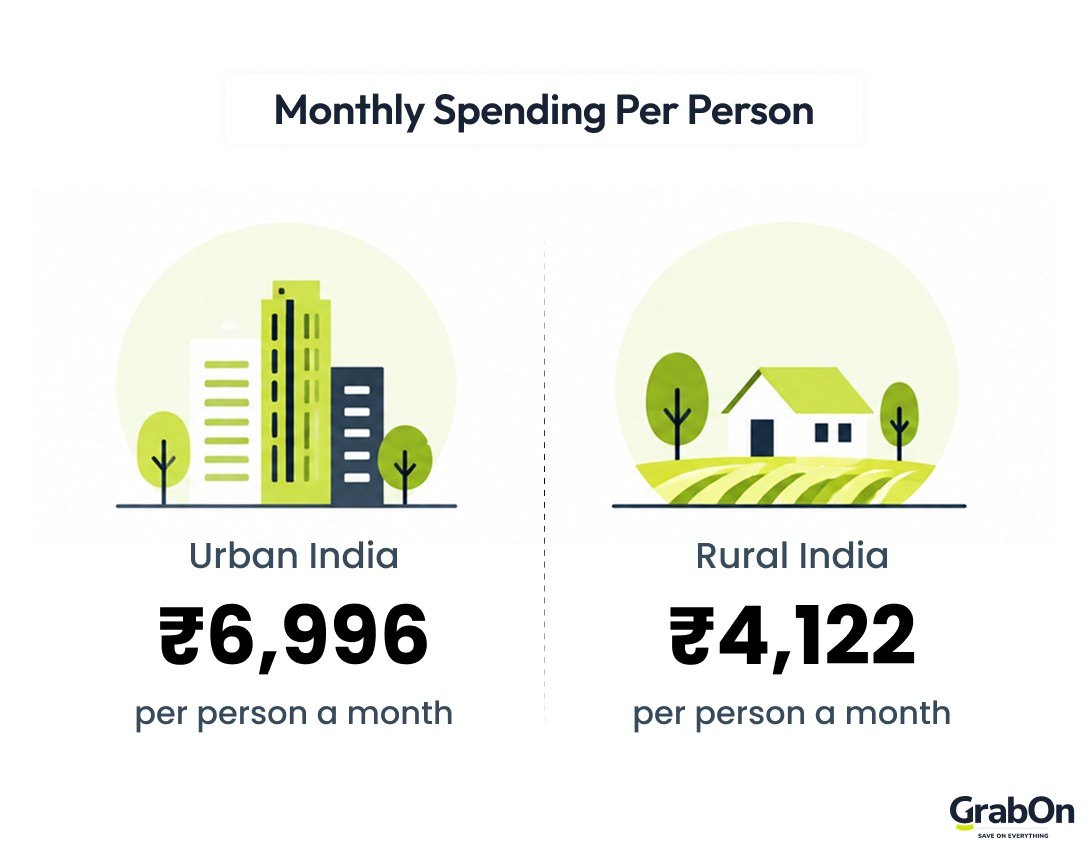
- Rural India spends ₹4,122 per person a month out of pocket. Once you add the market value of free government benefits, like food grains and healthcare subsidies, that figure climbs to ₹4,247.
So the real gap between what rural households consume and what they pay for isn’t small; welfare support fills in quite a share of it.
- The total consumer spending in India reached ₹49,686 billion in the first quarter of 2026.
That spending accounts for nearly 60% of India’s GDP, making household consumption the single biggest contributor to the country’s economic output.
(Source: MoSPI)
Rural Versus Urban Consumer Spending Gap in 2026
- Urban households spent 84% more than rural households in 2011-12, a massive gap at the time.
- The urban-rural spending gap dropped to 71.2% by 2023, and further to 69.8% in 2026.
- Rural spending is growing faster than urban spending, at about 9% a year versus 8%.
- Urban households still spend roughly 1.7 times more than rural households in absolute rupee terms, even as the gap narrows.
- Improved roads, reliable electricity, and direct government cash transfers mean rural families have more money available to spend right now.
- Fast internet and UPI have connected deep rural areas to the modern digital economy, making it easier than ever for people in small towns to shop for discretionary products.
| Survey Benchmark Period | Urban-to-Rural Expenditure Ratio | Measured Expenditure Gap Percentage | Primary Convergence Factor |
| 2011 to 2012 Survey | 1.84x | 83.9% | Traditional agrarian baseline |
| 2022 to 2023 Survey | 1.71x | 71.2% | Road connectivity and electrification |
| 2026 Benchmark | 1.70x | 69.8% | Digital retail and banking formalization |
(Source: MoSPI)
Why is India Spending Less on Food?
Indian households have crossed an economic milestone known as Engel’s Law, meaning that as household incomes rise, the proportion of expenditure allocated to food strictly decreases.
- Urban households now allocate 60.83% of their total budget to non-food items, leaving only 39.17% for basic food sustenance.
- Rural households allocate 53.62% of their total budget to non-food items. This marks the first sustained period in Indian history where non-food spending exceeds food spending in rural India.
- Direct budget shares for staple cereals like rice and wheat are below 5% in urban households and below 9% in rural households.
Free food grain allocations under central welfare schemes have reduced the need for out-of-pocket spending, freeing up capital. This capital has shifted toward conveyance, consumer electronics, and personal lifestyle services, reflecting a switch from survival budgeting to lifestyle budgeting.
| Consumption Category | 2011 to 2012 Urban Budget Share | 2026 Urban Budget Share | 2011 to 2012 Rural Budget Share | 2026 Rural Budget Share |
| Food and Staples | 42.60% | 39.17% | 52.90% | 46.38% |
| Non-Food and Discretionary | 57.40% | 60.83% | 47.10% | 53.62% |
| Net Discretionary Shift | Baseline | +343 bps | Baseline | +652 bps |
(Source: MoSPI)
Category-Wise Breakdown of Indian Household Spending in 2026
- Beverages, refreshments, and processed foods account for the largest individual share of the urban food budget at 11.09%. This reflects a heavy reliance on quick-commerce deliveries and packaged snacks.
- Conveyance and personal transport are the largest non-food expense in urban India at 8.46% of total monthly expenditure.
- Durable goods such as household appliances, personal electronics, and motorized vehicles consume 6.87% of urban spending and 6.48% of rural spending.
- Rent and housing maintenance make up 6.58% of the average urban Indian’s monthly spending.
- Education claims 5.97% of urban expenditure, driven by the rising costs of private schooling, competitive test coaching, and digital learning platforms.
- Clothing, bedding, and footwear claim 6.63% of rural budgets, standing as the highest single non-food expense in rural households.
| Expenditure Category | Urban Budget Share | Rural Budget Share | Average Urban Monthly Spend | Average Rural Monthly Spend |
| Beverages and Processed Foods | 11.09% | 9.84% | ₹776 | ₹406 |
| Conveyance and Transport | 8.46% | 7.59% | ₹592 | ₹313 |
| Durable Goods | 6.87% | 6.48% | ₹481 | ₹267 |
| Rent and Housing Amenities | 6.58% | N/A | ₹460 | N/A |
| Education Services | 5.97% | 3.24% | ₹418 | ₹133 |
| Clothing, Bedding, and Footwear | 5.66% | 6.63% | ₹396 | ₹273 |
| Medical and Outpatient Healthcare | 5.91% | 6.83% | ₹413 | ₹281 |
| Entertainment and Misc. Goods | 6.92% | 6.22% | ₹484 | ₹256 |
(Source: MoSPI)
Are Indians Planning to Spend More in 2026?
- Research indicates that 60% of surveyed Indian households anticipate increasing their overall spending over the coming six months.
- Approximately 70% of surveyed consumers plan to increase expenditure on automobiles and two-wheelers.
- Around 63% of consumers intend to spend more on smartphones, consumer electronics, and upgraded telecom data plans.
- The Reserve Bank of India’s Future Expectations Index stands firmly at 123.4 points, confirming strong medium-term consumer confidence in household income and employment prospects.
- The RBI’s Current Situation Index sits slightly lower at 98.1 points, showing households are more cautious about today’s rising living costs.
- Over 82% of households expect general price levels to climb further, which ironically accelerates immediate purchase timelines for durable goods before the anticipated price revisions hit the market.
(Sources: RBI Consumer Confidence Survey, Economic Times)
State-wise Household Expenditure Statistics Across India
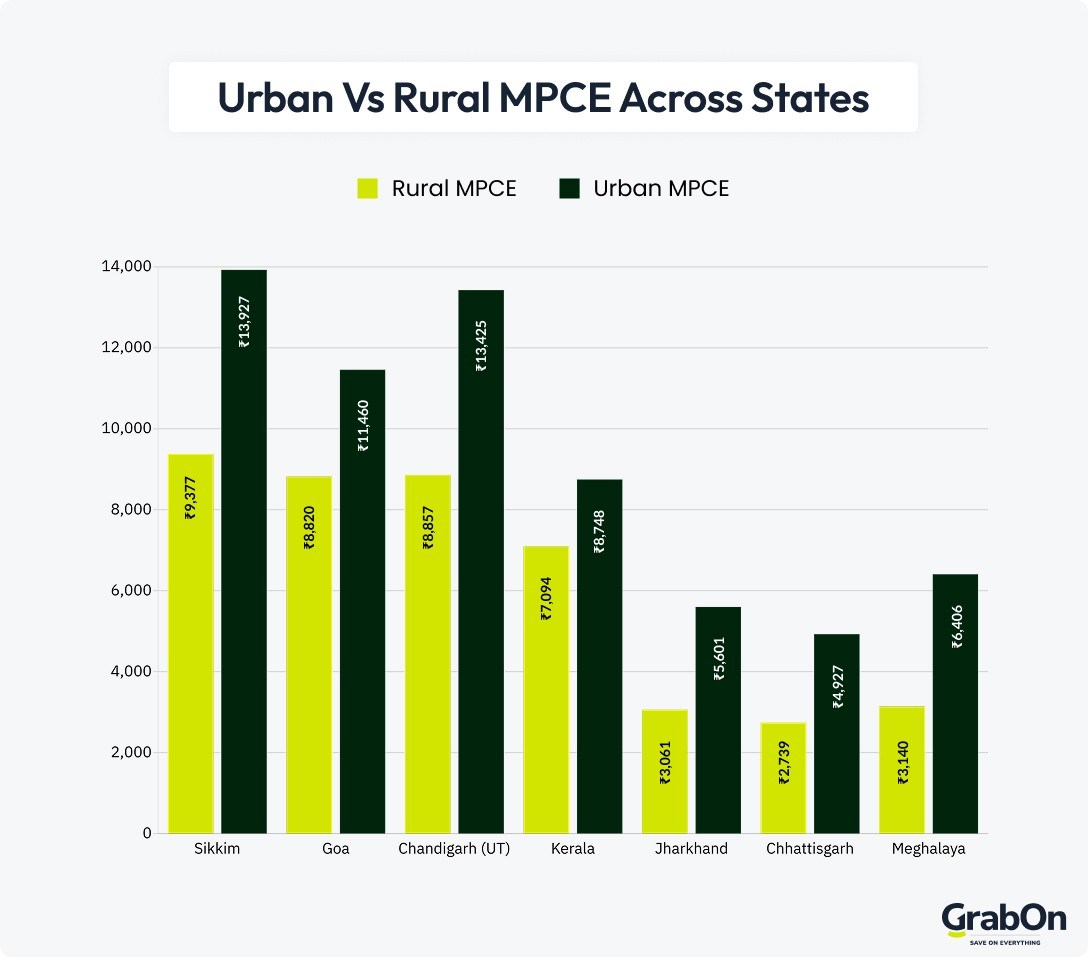
- Sikkim leads all Indian states in total consumption, recording an urban monthly per capita expenditure of ₹13,927 and a rural expenditure of ₹9,377.
- Goa ranks as the second-highest spending state nationwide, with urban monthly per capita expenditure reaching ₹11,460 and rural expenditure reaching ₹8,820.
- Chandigarh tops the Union Territories with an urban monthly per capita expenditure of ₹13,425.
- Chhattisgarh reports the lowest consumption spending nationwide, with rural monthly expenditure sitting at just ₹2,739 and urban expenditure at ₹4,927.
- Jharkhand records the second-lowest rural spending at ₹3,061 per capita per month, alongside an urban spend of ₹5,601.
- Meghalaya exhibits the widest internal spending inequality in the country, with urban household expenditure exceeding rural expenditure by an astonishing 104%.
- Jharkhand and Chhattisgarh show a similar pattern, with cities spending 83% and 80% more than their surrounding rural areas. This shows how far behind rural areas are as urban areas modernize.
| State or Union Territory | Rural Monthly MPCE (Per Capita Spending) | Urban Monthly MPCE | Urban-to-Rural Expenditure Premium |
| Sikkim | ₹9,377 | ₹13,927 | +48.5% |
| Goa | ₹8,820 | ₹11,460 | +29.9% |
| Chandigarh (UT) | ₹8,857 | ₹13,425 | +51.6% |
| Kerala | ₹7,094 | ₹8,748 | +23.3% |
| Jharkhand | ₹3,061 | ₹5,601 | +83.0% |
| Chhattisgarh | ₹2,739 | ₹4,927 | +79.9% |
| Meghalaya | ₹3,140 | ₹6,406 | +104.0% |
(Source: MoSPI)
How Has Indian Household Spending Transformed Since 2011
2011-12 was the last full nationwide household spending survey before the current one, making it the standard baseline for measuring how India’s spending habits have shifted over the past decade-plus.
- The proportion of urban household budgets spent on basic food staples dropped from 42.60% in 2011 to 39.17% in 2026.
- Urban spending on durable goods, like appliances and electronics, rose from 5.60% to 6.87%, a 22.7% increase.
- Conveyance and personal transit spending grew from 6.52% to 8.46% of urban budgets, becoming the fastest-growing non-food category.
- Spending on packaged and processed food increased from 8.98% to 11.09% in urban areas, reflecting changing urban dining habits and the demand for time-saving meals.
- The number of goods and services tracked in the official Ministry of Statistics and Programme Implementation (MoSPI) survey grew from 347 to 405 items, reflecting how much more Indian consumers now buy.
- The urban Gini coefficient, a measure of inequality where 0 means everyone spends the same and 1 means one household accounts for all spending, fell from 0.314 to 0.284, meaning urban spending is more evenly distributed than before.
- The rural Gini coefficient fell from 0.266 to 0.237, showing the same trend toward more even spending across rural households.
| Household Consumption Component | 2011 to 2012 Urban Baseline | 2026 Urban Benchmark | Net Structural Shift | Long-Term Trend Direction |
| Food and Cereal Basket | 42.60% | 39.17% | -343 bps (base points) | Structural Contraction |
| Conveyance and Mobility | 6.52% | 8.46% | +194 bps | High Expansion |
| Durable Consumer Goods | 5.60% | 6.87% | +127 bps | High Expansion |
| Packaged Foods and Beverages | 8.98% | 11.09% | +211 bps | Moderate Expansion |
| Apparel and Footwear | 6.90% | 5.66% | -124 bps | Value Deflation |
(Source: MoSPI)
How Does Income Level Affect Consumer Spending Patterns
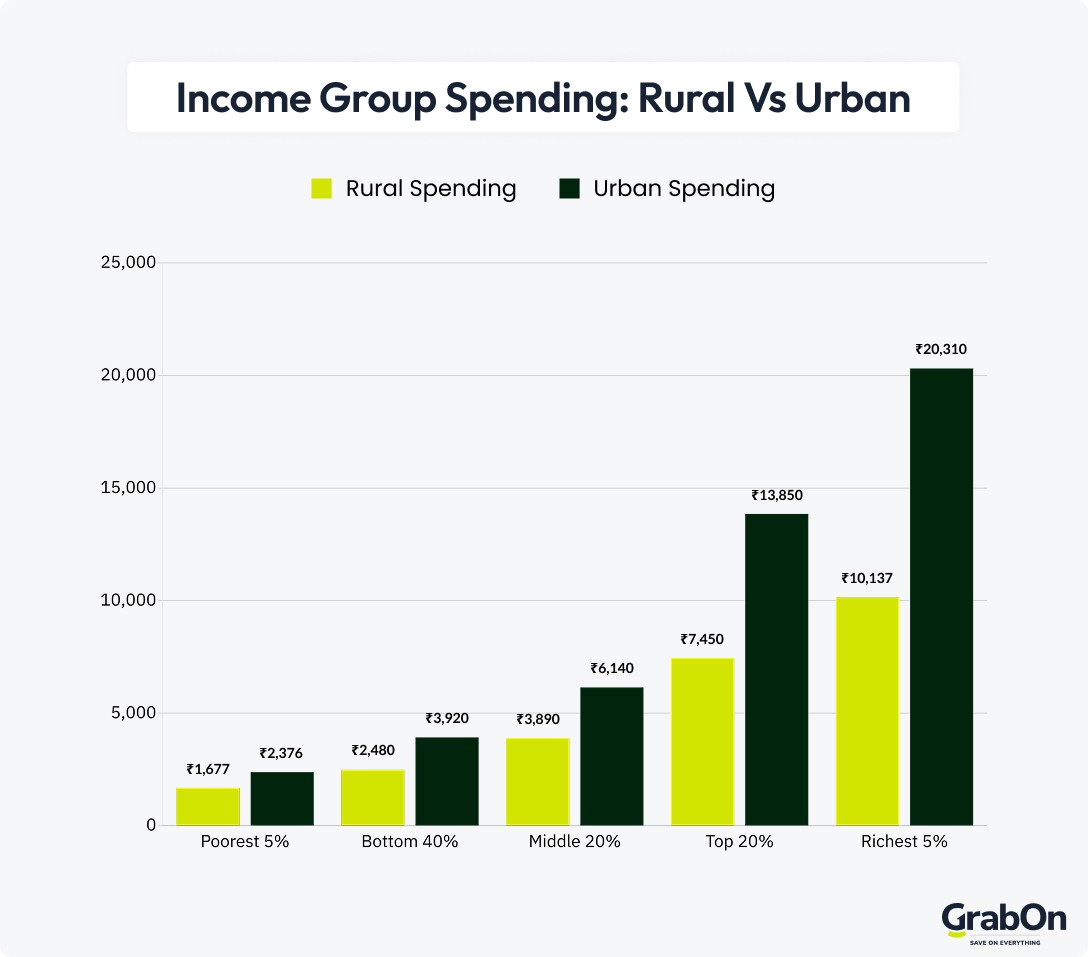
- The bottom 5% of the urban population survives on an average of ₹2,376 per month, directing over 56% of it to basic food and household fuel.
- The top 5% of the urban population spends an average of ₹20,310 per month, allocating over 75% of their budget to discretionary services, recreation, and luxury goods.
- The bottom 5% of the rural population spends an average of ₹1,677 per month, with approximately 61% of this spending concentrated on basic sustenance and survival utilities.
- The top 5% of the rural population spends an average of ₹10,137 per month, a spending pattern similar to middle-income urban households.
- Rural regular wage and salaried households in non-agricultural sectors report the highest average rural spending at ₹5,005 a month.
- The bottom 5% fractile class actually experienced the fastest spending growth over the past year, with their expenditure rising by 22% in rural regions and 19% in urban areas.
| Income Group | Rural Spending | Urban Spending | Mostly Spent On |
| Poorest 5% | ₹1,677 | ₹2,376 | Basic food, fuel |
| Bottom 40% | ₹2,480 | ₹3,920 | Groceries, utility bills |
| Middle 20% | ₹3,890 | ₹6,140 | Packaged food, mobile, fuel |
| Top 20% | ₹7,450 | ₹13,850 | Durables, dining out, schooling |
| Richest 5% | ₹10,137 | ₹20,310 | Electronics, vehicles, travel |
(Source: MoSPI)
How Digital Adoption and Ecommerce Trends are Reshaping Indian Household Spending
- Consumer purchase intent toward smartphones and mobile data plans currently stands at 63%, increasing domestic digital commerce participation.
- Urban households in tier-1 and tier-2 cities now spend 18-22% of their grocery budget through 10-minute delivery apps.
- Online marketplaces now account for 45% of urban purchases of home appliances and electronics.
- Online fashion platforms and digital storefronts currently account for 32% of total footwear and clothing purchases made by Indian consumers under 35 years of age.
- UPI now handles over 78% of online retail checkouts, making it easier for shoppers to complete purchases.
- Digital grocery orders average between ₹450 and ₹750 per basket in major metropolitan cities.
| Digital Category | Households Using It | Avg. Monthly Spend | Why People Use It |
| Quick-Commerce Grocery | 38% | ₹2,400 | Delivery in under 15 minutes |
| Online Marketplaces | 62% | ₹3,800 | More choice, easy reviews |
| Food Delivery Apps | 41% | ₹1,650 | Restaurant access, convenience |
| OTT & Media Subscriptions | 44% | ₹450 | Bundled with telecom plans |
(Sources: MoSPI, ANI)
Why Indians Spend More During Festive Season
- Spending on electronics, home renovations, and festive clothing jumps 40-75% during the festive quarter, September through December.
Since over 60% of urban household budgets already go to non-essential items, festive sales are when that spending really peaks.
- Over 35% of consumers report deliberately delaying major electronics and appliance purchases for months to get festival discounts and promotional codes.
Shoppers lean heavily on cashbacks and coupons on electronics, flight bookings, and fashion to save during this period.
- No-cost EMIs and instant card cashback fund over 50% of big-ticket electronics purchases during major festive sales events.
- The national monthly per capita expenditure temporarily increases by up to 25% above annual baseline figures during October and November.
(Source: Razorpay, LocalCircles)
Why India’s Spending Habits are Changing in 2026
- Rising prices are the biggest factor behind the shift in spending behavior, with households in urban India perceiving inflation at 7.8% and those in rural India at 5.9%.
- 69% of households now use price comparison apps, buy in bulk, or use coupons for non-essential purchases as prices climb.
- The demand for convenience has pushed spending on packaged and ready-to-eat food to 11.09% of urban budgets.
- 57% of households expect higher salaries or business income in 2027, keeping overall spending confidence strong.
(Source: RBI, MoSPI)
India’s Consumer Spending Forecast (2027-28 Projections)
- India’s total consumer spending is expected to keep growing past the ₹49,686 billion recorded in early 2026.
- The RBI’s Current Situation Index, which tracks how households feel about their spending right now, is expected to recover from 98.1 to above 102 points by 2027.
- The Future Expectations Index is projected to stay strong, near 125 points through 2028, pointing to continued confidence in future income growth.
- The Consumer Price Index is projected to rise to 114.33 points in 2027 and 119.01 points by 2028.
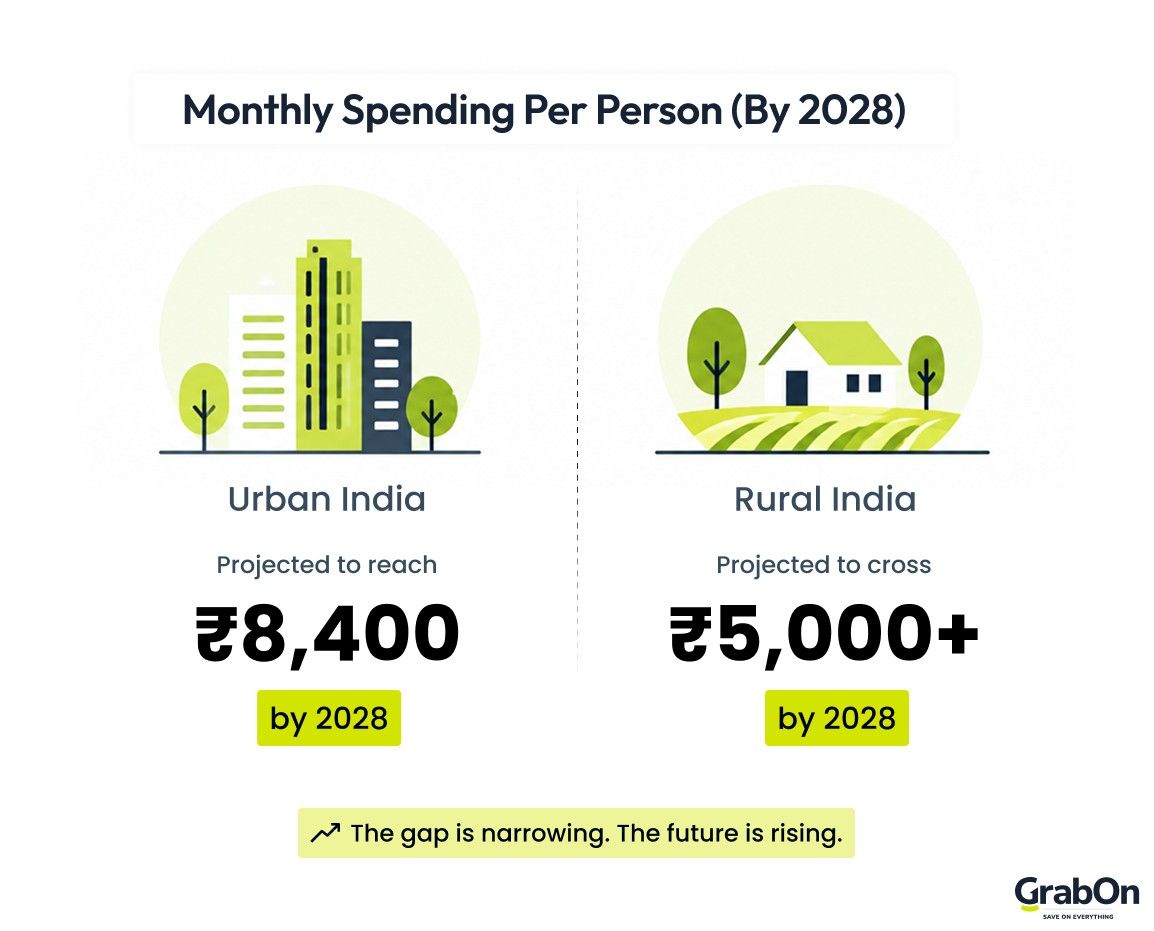
- Urban monthly spending per person is projected to grow 8-10% a year, reaching ₹8,400 by 2028.
- Rural monthly spending per person is projected to cross ₹5,000 by 2028, narrowing the urban-rural spending gap to below 66%.
- About 25 million more households are expected to move into the discretionary spending bracket by 2028, driving demand for vehicles, electronics, and travel.
(Sources: Trading Economics, RBI, MoSPI)
To Conclude
In 2026, the data points to one clear reality: Indian households have more room in their budgets than before. The gap between rural and urban spending is at a record low, and discretionary categories now make up more of what people actually buy. Rising living costs might keep people hunting for deals in the short term, but with domestic consumption on track to hit ₹54,500 billion by 2028, everyday spending will continue to drive India’s broader growth story.