Around 38% of the globe’s population is now on WhatsApp and exchanges over 140 billion messages daily.
The feature-rich application has many use cases for both users and businesses, and with the introduction of WhatsApp Business, brands are especially giving additional importance to the platform.
In a landmark leadership move in June 2026, Meta appointed Kunal Shah, the founder of Indian fintech company CRED, as the new global head of WhatsApp, replacing Will Cathcart who led the platform for over seven years. The appointment, which came alongside Meta’s $900 million investment in CRED, signals how central India has become to WhatsApp’s future strategy across payments, commerce, and business communications.
Let us see the app’s demographic data in this post in detail.
WhatsApp User Statistics (Top Picks)
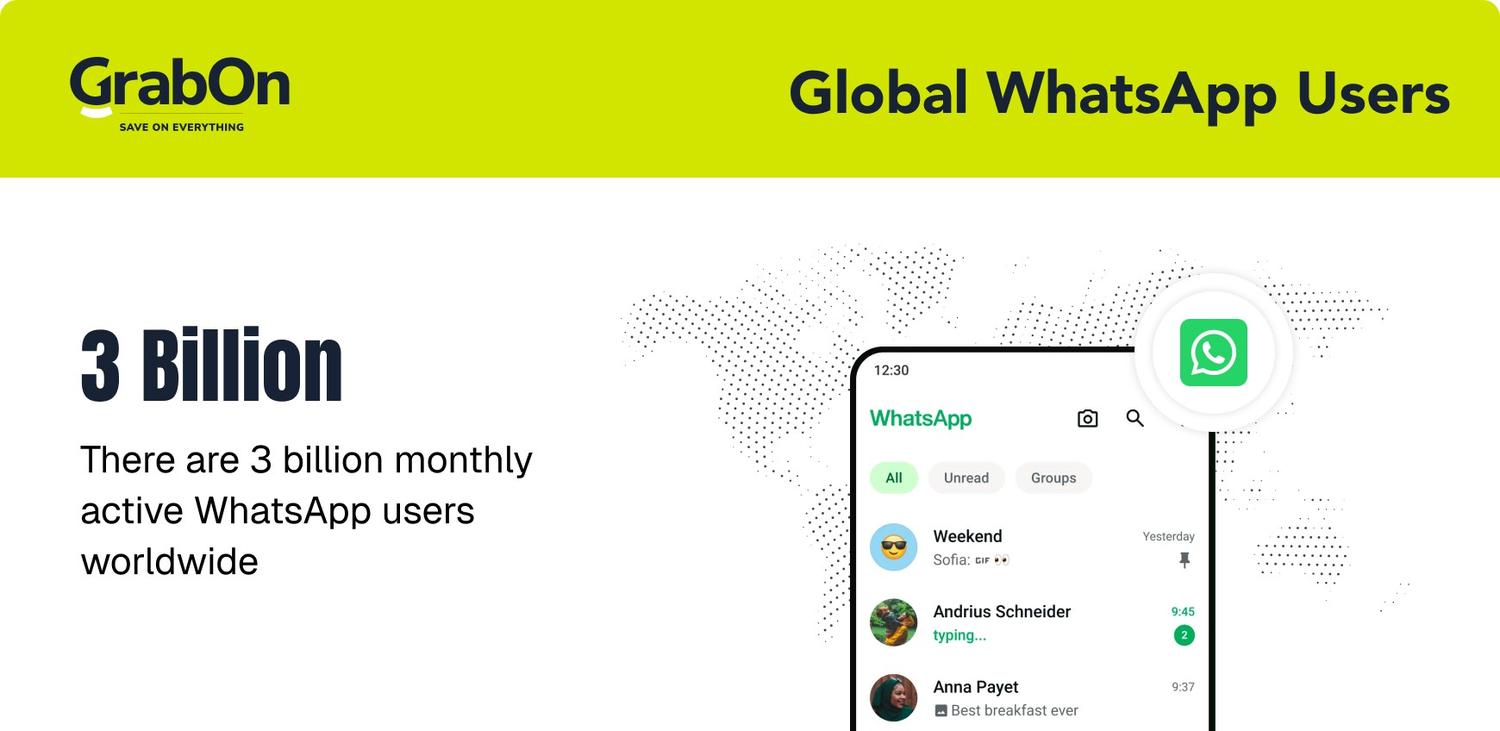
- There are currently 3 billion monthly active WhatsApp users globally.
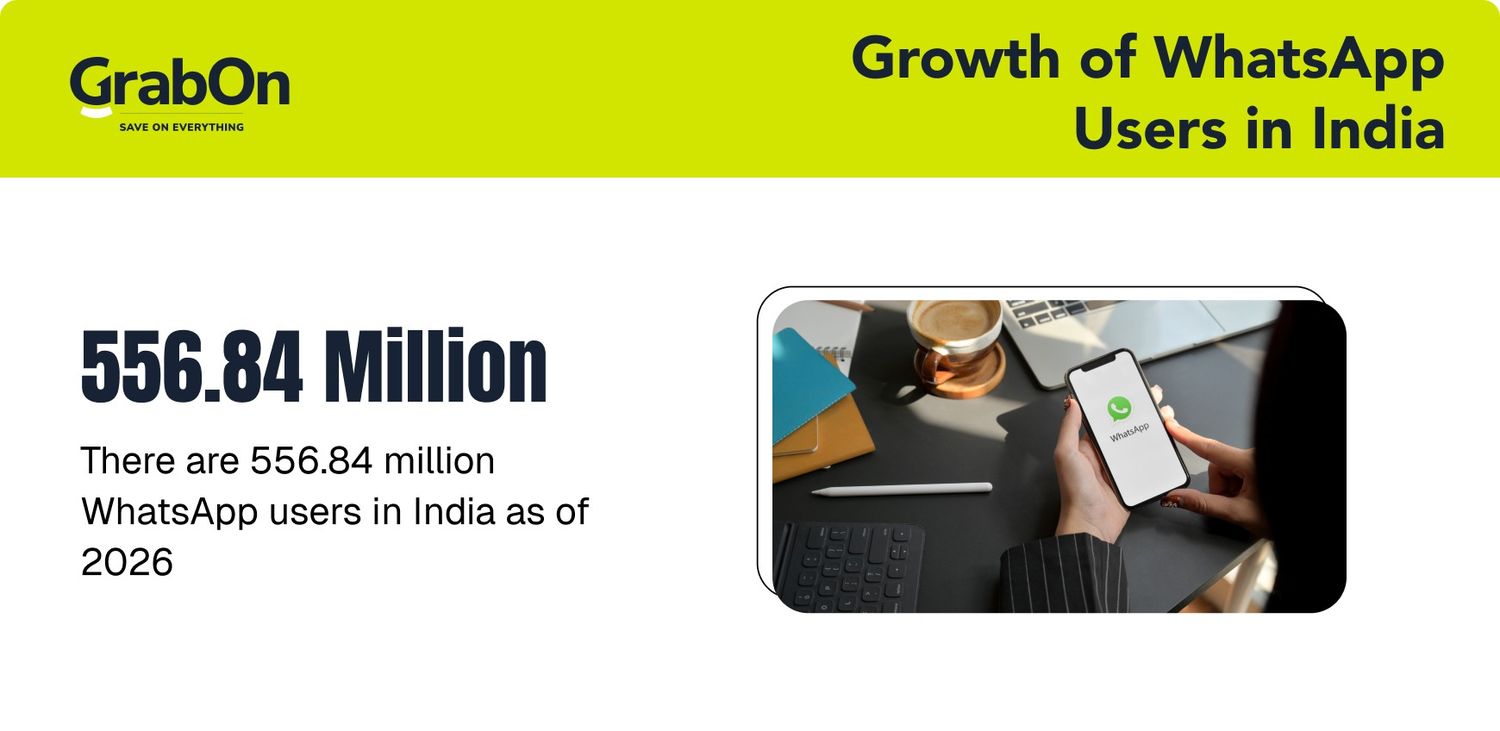
- India is the leading nation in terms of WhatsApp users, with a count of 556.84 million.
- 47.7% of WhatsApp users are female, while 52.2% are male.
- An average WhatsApp user spends 21 hours each month on the app.
- There are 764.38 million WhatsApp Business monthly active users as of 2026.
Number of WhatsApp Users (Global)
There are 3 billion monthly active WhatsApp users worldwide, equivalent to 36.6% of the global population. WhatsApp added 89.72 million new users in the first half of 2024 alone.
The number of active WhatsApp users is expected to reach 3.5 billion by 2025.
| Year | WhatsApp Users |
| 2010 | 10 million |
| 2011 | 50 million |
| 2012 | 100 million |
| 2013 | 400 million |
| 2014 | 600 million |
| 2015 | 900 million |
| 2016 | 1 billion |
| 2017 | 1.5 billion |
| 2018 | 1.68 billion |
| 2019 | 1.83 billion |
| 2020 | 2.06 billion |
| 2021 | 2.19 billion |
| 2022 | 2.66 billion |
| 2023 | 2.86 billion |
| 2024 | 2.95 billion |
| 2025 | 3 billion |
Source: Statista.
WhatsApp Users By Country
India has the largest WhatsApp user share, with a headcount of over 556.84 million.
Brazil takes the second spot with 148 million users, Indonesia has 112 million and rounds up to the third spot, and the United States has 100 million WhatsApp users.
Americans tend to use iMessage or Facebook Messenger more than WhatsApp but things are slowly shifting with WhatsApp becoming more functional daily.
Here’s a table showing the number of WhatsApp users by country.
| Country | Number of Whatsapp Users |
| India | 556.84 |
| Brazil | 148 million |
| Indonesia | 112 million |
| United States | 100 million |
| Philippines | 88 million |
| Mexico | 77 million |
| Russia | 66.7 million |
| Turkey | 60 million |
| Egypt | 56 million |
| Pakistan | 52 million |
Source: WPR, Statista and WhatsApp blog.
Growth of WhatsApp Users in India
There are 556.84 million WhatsApp users in India as of 2026, a 1.25% increase from the previous year. India is the leading nation in WhatsApp user count, the nation’s 68.2% of digital population uses WhatsApp.
India’s dominance in WhatsApp’s user base has directly shaped Meta’s corporate strategy. The June 2026 appointment of CRED founder Kunal Shah as WhatsApp’s global head, paired with Meta’s $900 million investment in CRED at a $4.5 billion valuation, underscores how India has moved from being WhatsApp’s largest market to the centre of its product roadmap.
Shah’s background in fintech and digital payments is expected to accelerate WhatsApp’s push into payments and commerce in India, where WhatsApp Pay currently holds less than 1% UPI market share against dominant players PhonePe and Google Pay.
Here is a table showing the growth of WhatsApp users in India over the years.
| Year | WhatsApp Users in India |
| 2021 | 493.31 |
| 2022 | 507.47 |
| 2023 | 521.63 |
| 2024 | 535.80 |
| 2025 | 549.96 |
| 2026 | 556.84 |
WhatsApp User Count in the United States
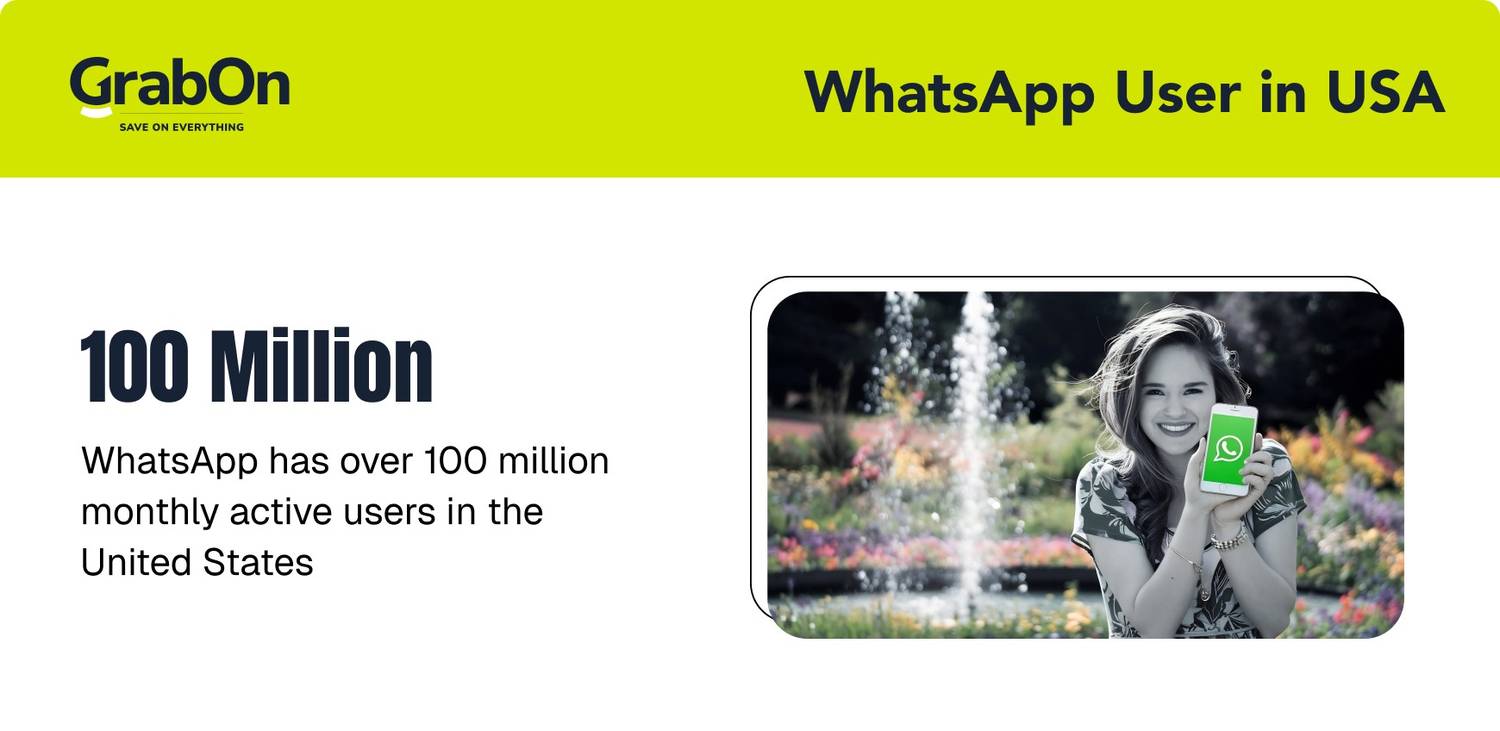
As per Meta’s official report, WhatsApp has over 100 million monthly active users in the United States accounting for 29.8% of the country’s population.
WhatsApp Demographics
Here is a detailed look at WhatsApp’s demographics by age, gender and generation.
WhatsApp Users by Age
WhatsApp is most popular among individuals aged 18 to 34, who comprise 31% of its user base. In contrast, those over 65 years old are the least likely to use WhatsApp, accounting for only 11% of its users.
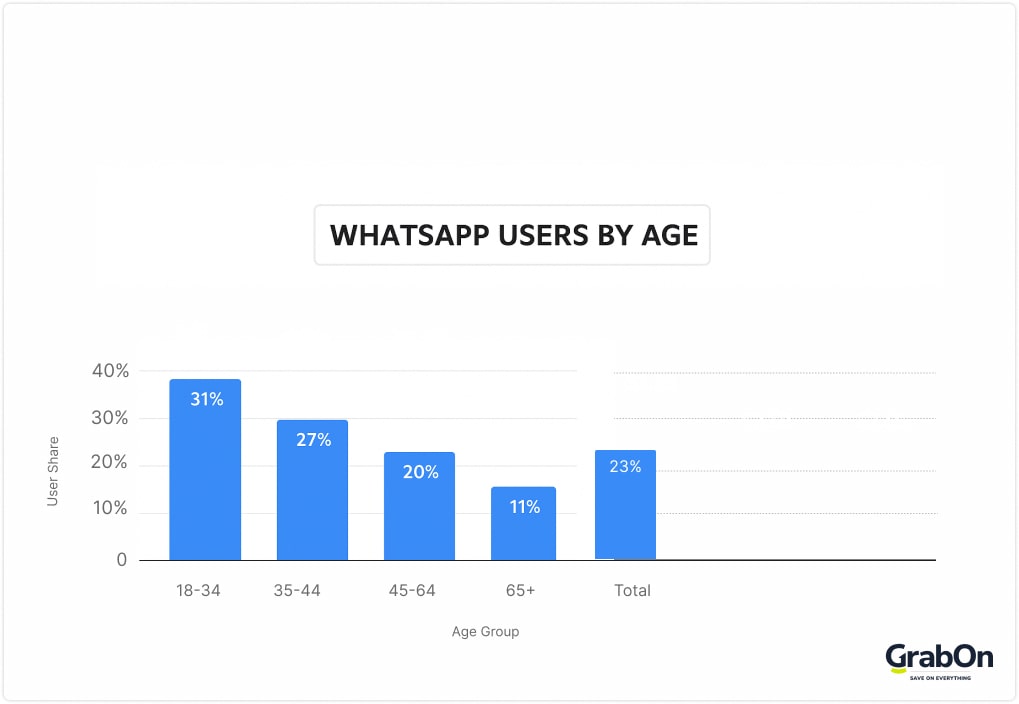
The table below shows the distribution of WhatsApp users by age:
| Age Group | User Share |
| 18-34 | 31% |
| 35-44 | 27% |
| 45-64 | 20% |
| 65+ | 11% |
| Total | 23% |
WhatsApp Users by Generation
36.4% of Millennials use WhatsApp, followed by Gen Z at 23.6%, Gen X at 22.7%, and Baby Boomers at 12.8%.
Here is a table showing WhatsApp users by generation.
| Generation | Share of WhatsApp Users |
| Gen Z (1997-2012) | 23.6% |
| Millennials (1981-1996) | 36.4% |
| Gen X (1965-1980) | 22.7% |
| Baby Boomers (1946-1964) | 12.8% |
| Other (Silent Generation, Gen Alpha, and younger) | 4.5% |
Most Americans aged 18 to 35 who own a cellphone have installed WhatsApp, according to the company’s studies. This makes it one of Meta’s fastest-growing services in its most mature market.
Source: eMarketer and NYTimes.
WhatsApp Users by Race
In the US, over half of Hispanic adults, 54%, and over half of Asian adults, 51%, use WhatsApp. In comparison, only 31% of Black adults and an even smaller percentage of White adults, 20%, use the app.
Source: PewResearch.
Whatsapp Users by Gender
47.7% of WhatsApp users are female, while 52.2% are male. This is not a wide gender gap but a notable difference of 4.5%.
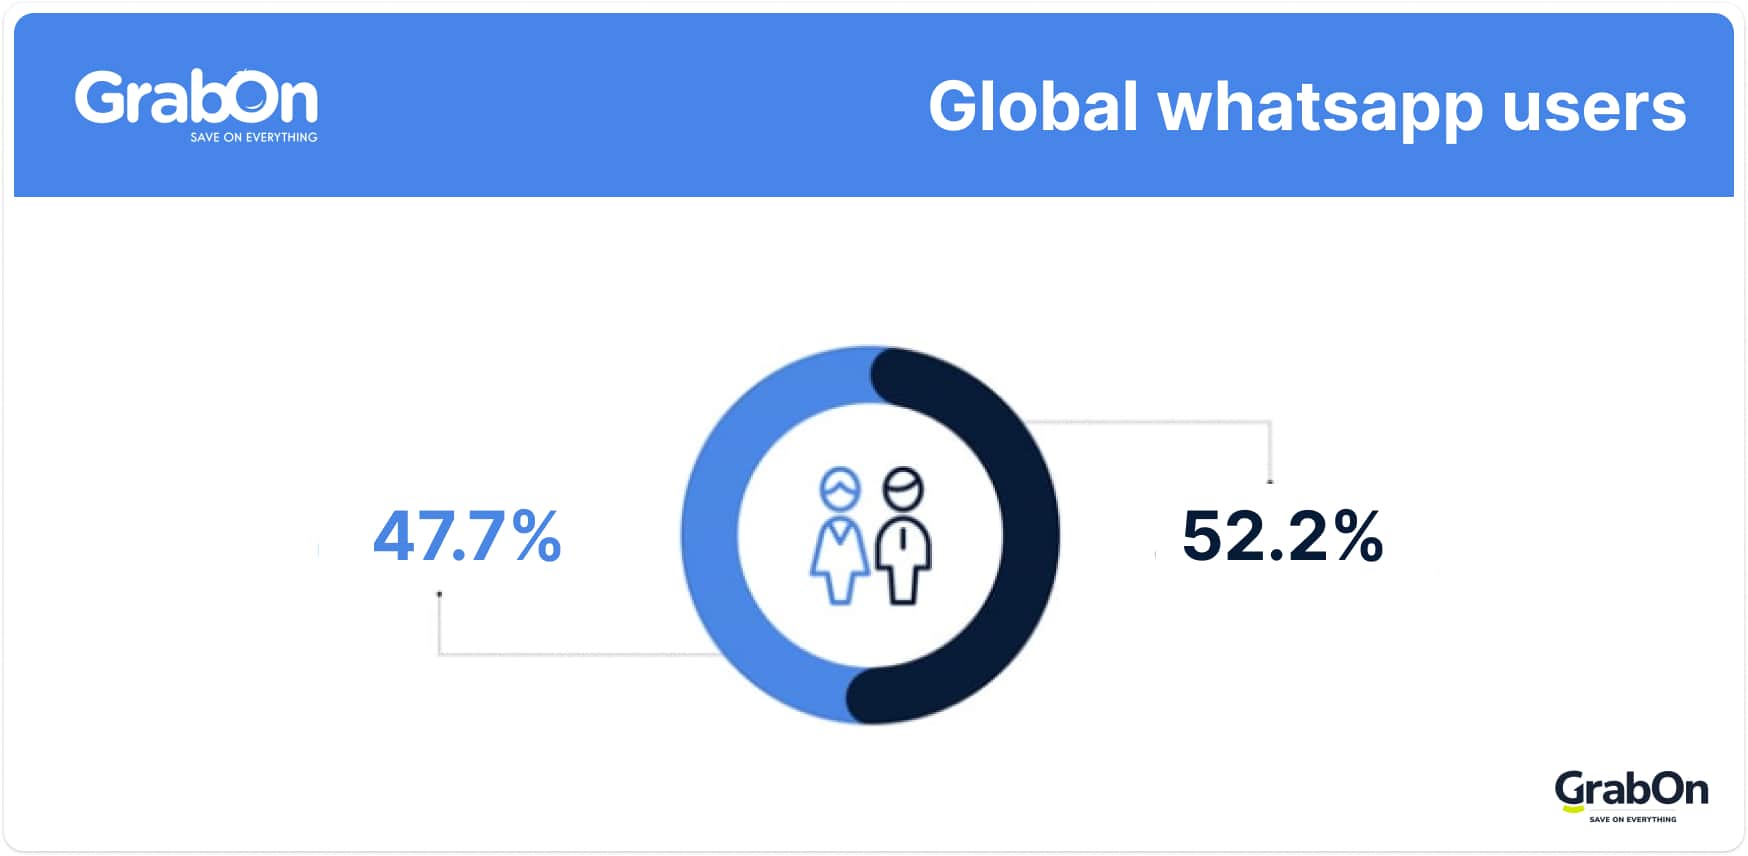
Here is a table showing the Gender split of WhatsApp users.
| Gender | WhatsApp User Share |
| Male | 52.2% |
| Female | 47.7% |
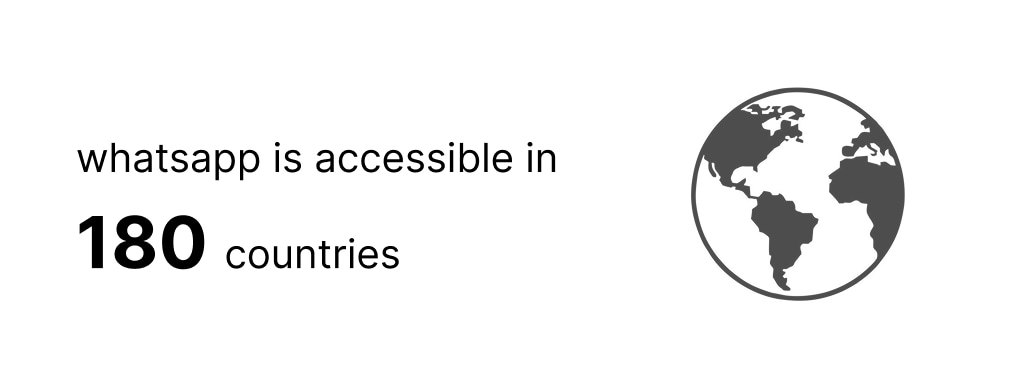
Global Reach of WhatsApp
WhatsApp is accessible in over 180 countries, making it one of the most widely used messaging platforms in the world. This global presence has made WhatsApp an essential tool for personal messaging, business interactions, and customer engagement on a worldwide scale.
Source: Analyzify
Average Time Spent on WhatsApp
An average Android user spends 17 hours each month on WhatsApp, which translates to about 34 minutes per day.
70% of WhatsApp users check the app every day.
In the United States, users spend around 7.6 hours per month on WhatsApp, with 53% using the app at least once a day.
Brazil, Indonesia, and Argentina are the top three countries in terms of average monthly time spent on WhatsApp, with users spending 29 hours, 29 hours, and 28 hours per month, respectively.
India comes next with 21 hours per month, while Australian users spend around 6 hours per month.
Source: Meetanshi.
Number of Messages Sent on WhatsApp Daily
140 billion messages are sent on WhatsApp each day. That translates to 5833 million messages every hour, 97 million messages every minute, and 1.6 million messages every second.
The number of messages sent on WhatsApp has increased by 33.33% since 2020, when users exchanged around 100 billion messages daily.
WhatsApp users exchange 7 billion voice notes every day. Also, users spend over 2 billion minutes a day making voice and video calls through its platform.
Source: WhatsApp blog.
WhatsApp Business Users
There are 764.38 million WhatsApp Business monthly active users.
WhatsApp Business was launched in the first quarter of 2018 and gained 1.82 million users in the initial quarter. Since then, the usage has only been increasing and is predicted to reach 900 million MAUs by the end of this year.

| Year | WhatsApp Business MAUs |
| 2018 Q1 | 1.82 |
| 2018 Q2 | 6.31 |
| 2018 Q3 | 12.72 |
| 2018 Q4 | 21.56 |
| 2019 Q1 | 31.92 |
| 2019 Q2 | 45.42 |
| 2019 Q3 | 64.05 |
| 2019 Q4 | 84.99 |
| 2020 Q1 | 108.65 |
| 2020 Q2 | 137.68 |
| 2020 Q3 | 178.70 |
| 2020 Q4 | 220.77 |
| 2021 Q1 | 245.21 |
| 2021 Q2 | 272.97 |
| 2021 Q3 | 312.24 |
| 2021 Q4 | 340.04 |
| 2022 Q1 | 381.9 |
| 2022 Q2 | 433.04 |
| 2022 Q3 | 482.69 |
| 2022 Q4 | 535.6 |
| 2023 Q1 | 579.36 |
| 2023 Q2 | 602.02 |
| 2023 Q3 | 646.82 |
| 2023 Q4 | 679.91 |
| 2024 Q1 | 718.29 |
| 2024 Q2 | 722.75 |
| 2024 Q3 | 747.57 |
| 2024 Q4 | 764.38 |
In May 2026, Meta launched WhatsApp Plus, a $2.99/month consumer subscription offering premium stickers, custom themes, up to 20 pinned chats, exclusive ringtones, and custom app icons.
This is part of Meta’s broader subscription strategy under the Meta One brand, which also includes paid tiers for Instagram ($3.99/month), Facebook ($3.99/month), and AI-focused Meta One plans ranging from $7.99 to $19.99/month.
The subscriptions are designed to diversify Meta’s revenue beyond advertising and monetize power users, while core features remain free for all users.
Source: Statista.
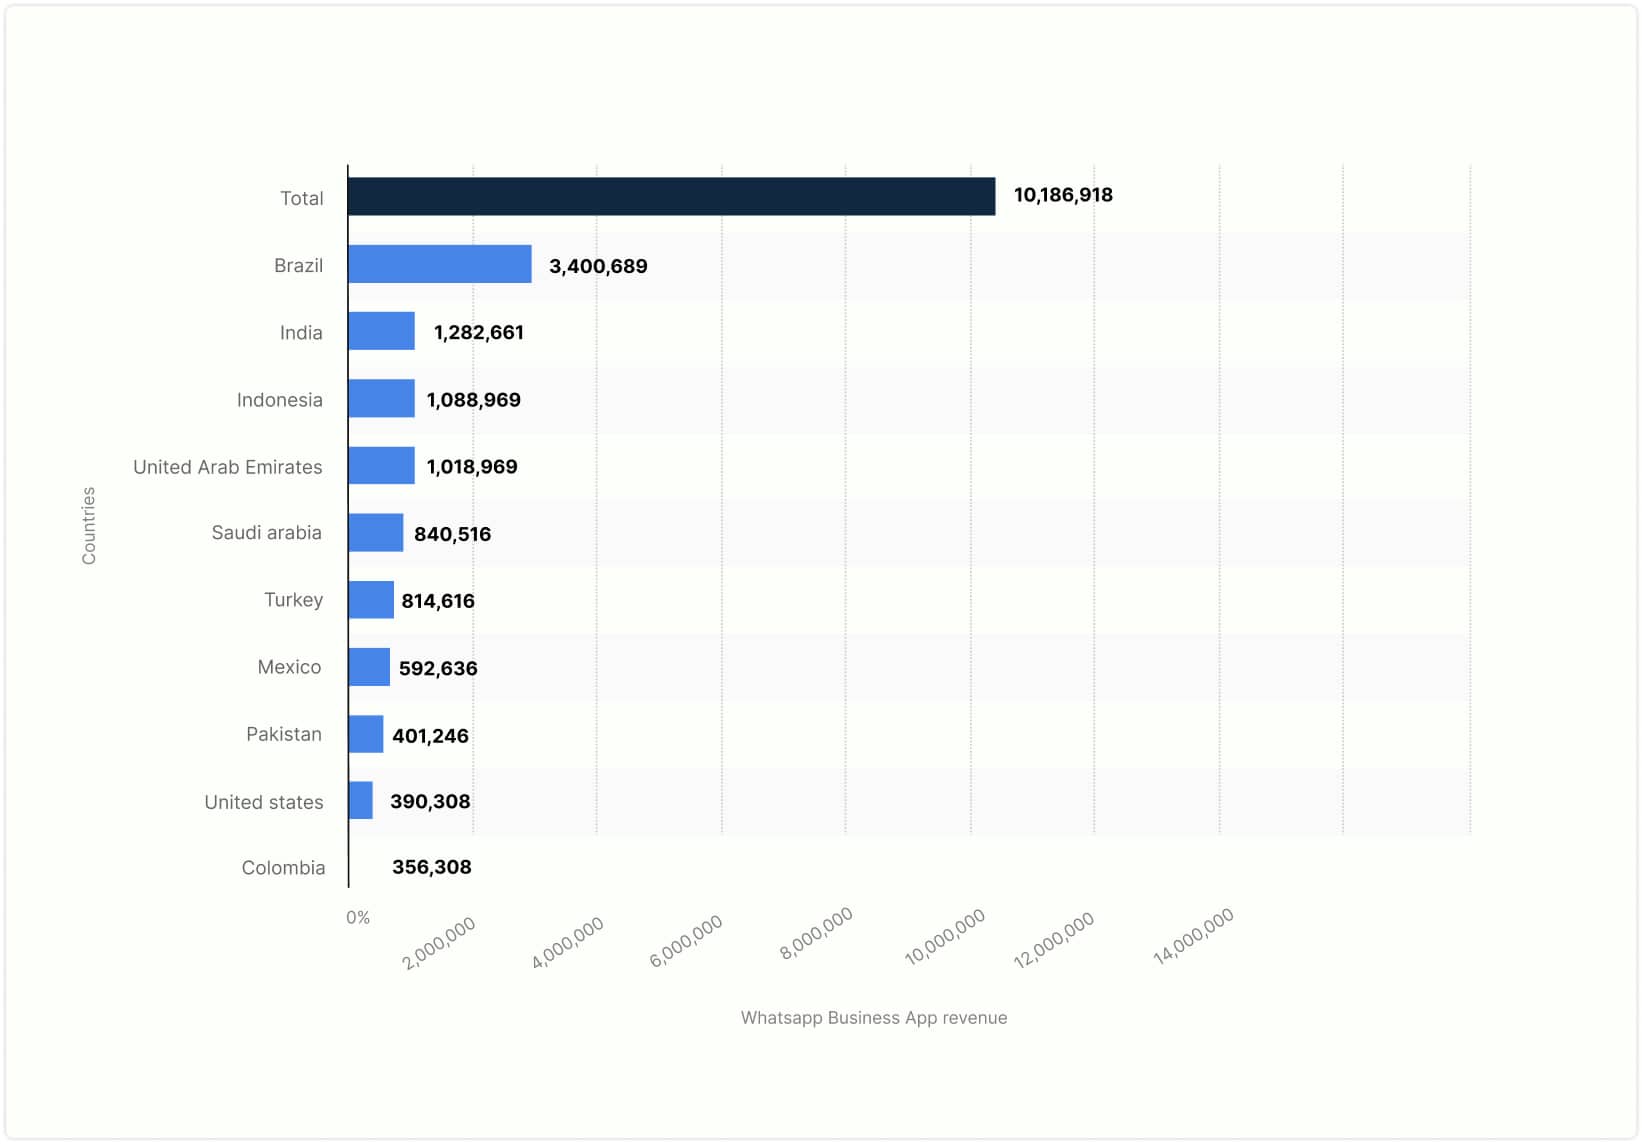
Countries with the highest lifetime WhatsApp Business app revenue
Brazil leads the global chart in lifetime WhatsApp Business app revenue, generating over $3.4 million, followed by India with $1.28 million and Indonesia with $1.08 million. These figures highlight the app’s strong influence across emerging markets, where businesses rely on WhatsApp as a key channel for communication, customer engagement, and digital sales.
In contrast, countries like the United States and Colombia show comparatively lower revenue figures of around $390,000 and $356,000, indicating slower adoption and different communication preferences.
| Countries | WhatsApp Business App Revenue |
| Brazil | 3,400,689 |
| India | 1,282,661 |
| Indonesia | 1,088,969 |
| United Arab Emirates | 1,018,969 |
| Saudi Arabia | 840,516 |
| Turkey | 814,616 |
| Mexico | 592,636 |
| Pakistan | 401,246 |
| United States | 390,308 |
| Colombia | 356,308 |
Source: Statista