The Unified Payments Interface (UPI) is a real-time digital payment system launched in April 2016 by the National Payments Corporation of India (NPCI) to transform how people send and receive money in India.
Since its launch, UPI has grown explosively and become the backbone of India’s digital payment ecosystem. What started with a few million transactions per month now processes tens of billions.
In January 2026, UPI recorded an all-time high of 21.7 billion transactions in a single month, totaling Rs. 28.33 lakh crore. This was according to data released by the National Payments Corporation of India (NPCI).
Beyond India, UPI is now accepted in multiple countries, including Bhutan, Nepal, Mauritius, Sri Lanka, Singapore, France, the UAE, and Qatar. Also, partnerships and rollouts are underway in other countries, such as Japan and Malaysia.
Let’s take a look at this technology through updated numbers and facts in this post.
UPI Statistics Top Picks
- Over 500 million people use UPI in India.
- By December 2025, UPI transactions reached a record high of Rs. 230 trillion, reflecting the rapid rise of digital payments across India.
- UPI users have collectively conducted transactions worth Rs. 80.79 trillion in the financial year 2024-2025.
- As of January 2026, PhonePe is the leading UPI application in the country.
- UPI technology is available in 8 countries outside of India.
Number of UPI Users In India
India has over 839 million active UPI users, which is 24% of the country’s population. PhonePe, the most popular UPI application in India, has 600 million registered users.
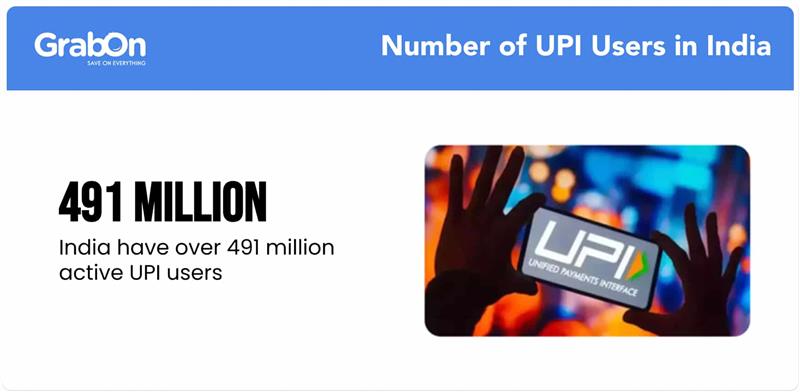
Source: NPCI White Paper, PhonePe.
UPI Transaction Volume Over The Years
UPI transaction volume reached 228.3 billion in 2025, compared to 131,129.50 million (131.13 billion) in 2024. This reflects a growth of nearly 74% compared to the previous year.
When compared to 2017, when UPI transactions stood at just 17.9 million, the increase has been extraordinary, marking a growth of over 1.27 million percent since its early adoption phase.
Here is a table showing UPI transaction volume from 2017 to 2025.
| Financial Year | Number of UPI Transactions |
| 2017 | 17.9 million |
| 2018 | 915.2 million |
| 2019 | 5,353.40 million |
| 2020 | 12,518.60 million |
| 2021 | 22,330.70 million |
| 2022 | 45,956.10 million |
| 2023 | 83,714.40 million |
| 2024 | 131,129.50 million |
| 2025 | 228.3 billion |
*Values up to date till 10th March 2025.
Source: NPCI
UPI Monthly Transaction Volume in FY 2024 to 2025
People carried out an average of 15.33 billion UPI transactions every month in the financial year 2024–2025. August 2025 recorded the highest transaction volume with 20 billion transactions.
Here is a table showing the UPI Monthly Transaction Volume in FY 2024 to 2025.
| Month | UPI Transaction Volume |
| April 2024 | 13.30 billion |
| May 2024 | 14.03 billion |
| June 2024 | 13.88 billion |
| July 2024 | 14.43 billion |
| August 2024 | 14.96 billion |
| September 2024 | 15.04 billion |
| October 2024 | 16.58 billion |
| November 2024 | 15.48 billion |
| December 2024 | 16.73 billion |
| January 2025 | 16.99 billion |
| February 2025 | 16.10 billion |
| March 2025* | 6.03 billion |
| August 2025 | 20 billion |
| September 2025 | 19.63 billion |
| October 2025 | 20.70 billion |
| November 2025 | 20.46 billion |
| December 2025 | 21.63 billion |
| January 2026 | 21.70 billion |
*Ongoing month at the time of writing this post.
Source: NPCI.
UPI Transactions Volume Daily
The average volume of UPI transactions is 743 million per day as of February 2026, an increase of 2.75% from December 2025, when the average volume was 764 million.
Source: NPCI.
Limit On Number of UPI Transactions Per User In a Day
Unified Payments Interface (UPI) transaction limits are set by the National Payments Corporation of India (NPCI) but may vary depending on individual banks and UPI apps. Generally, the per-transaction limit is up to ₹1 lakh. For certain categories, such as Capital Markets, Collections, Insurance, and Foreign Inward Remittances, the limit is ₹2 lakh. For Initial Public Offerings (IPOs) and the Retail Direct Scheme, it increases to ₹5 lakh.
General NPCI Guidelines:
- Per Transaction Limit: Up to ₹1 lakh.
- Daily Transaction Limit: Up to ₹1 lakh per bank account.
NPCI does not set a universal cap on the number of transactions per day; however, banks or UPI apps may impose their own limits, such as allowing 10 to 20 transactions per day or a daily cap of ₹1 lakh per bank account. Once the limit is reached, users typically need to wait 24 hours before initiating new transactions.
Source: NPCI FAQs.
UPI Usage By Country
UPI is steadily expanding across the globe. As of September 2025, UPI is available in the payment infrastructure of 8 countries outside India.
- Bhutan: The first country outside India to adopt UPI for QR-based payments on 13 July 2021, allowing Indian travellers and locals to pay with UPI at merchant locations.
- Singapore: UPI integration was officially launched on 21 February 2023 by linking India’s UPI with Singapore’s PayNow system, enabling instant cross-border payments.
- United Arab Emirates (UAE) – UPI rollout in the UAE began on 3 July 2024, with acceptance at more than 60,000 merchant locations, including malls and restaurants.
- France – The first European country to support UPI payments; UPI was launched at the Eiffel Tower on 2 February 2024, with use expanding to other retail outlets.
- Mauritius – UPI and RuPay were jointly launched on 12 February 2024, enabling Indian tourists and local users to make payments easily.
- Sri Lanka – UPI services were introduced on 12 February 2024 through partnerships with local payment network LankaPay, making QR-based UPI payments possible at select merchants.
- Nepal – UPI was launched on 8 March 2024 in partnership with Nepal’s Fonepay, helping Indian visitors and local merchants transact digitally.
- Qatar – UPI became available more broadly in 2025, with major retailers such as Qatar Duty Free accepting QR-based UPI payments after collaborations with Qatar National Bank (QNB) and payment partners.
Beyond these, India is in talks with over 30 nations, including New Zealand, Ghana, Zimbabwe, Cambodia, and the Maldives, to enable UPI adoption. The growing international acceptance of UPI signals its rising influence, making cross-border transactions more accessible and efficient.
Source: NPCI. Moneycontrol
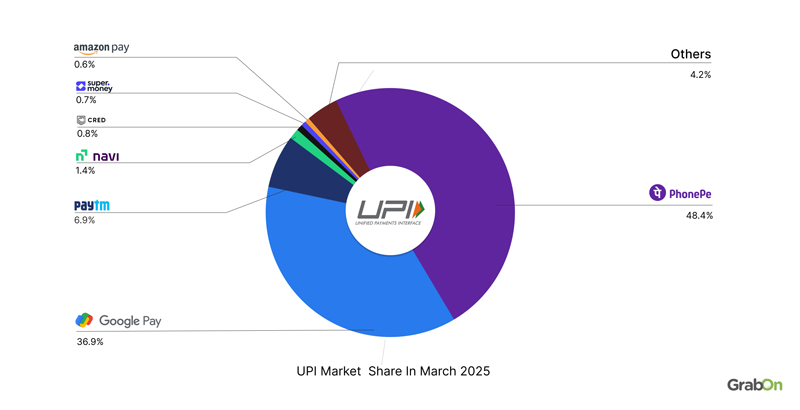
UPI Application Market Share In 2026
PhonePe is the leading UPI platform in India with a 48.4% market share followed by GooglePay with 36.9%. This means that both these players handle 85.3% of the country’s UPI transaction volume.
PayTM is another key player with a good 6.9% market share and emerging NAVI has managed to grab a 1.4% market share.
CRED (0.8%), Super Money (0.7%), and Amazon Pay (0.6%) make it to the top 7 players in the UPI space.
Here is the above data in tabular form for convenience.
| UPI Application | Market Share |
| PhonePe | 45.5% |
| GooglePay | 34.6% |
| PayTM | 7.4% |
| Navi | 2.8% |
| CRED | 0.8% |
| Super Money | 1.3% |
| BHIM | 0.7% |
| Amazon Pay | 0.5% |
| Others | 6.4% |
Source: NPCI.
UPI Fraud Statistics
In March 2025, UPI transactions hit a new record with a total value of Rs. 24.77 lakh crore, marking a significant rise from Rs. 18.41 lakh crore in March 2024. However, this surge in digital transactions also saw a corresponding increase in fraudulent activities.
During the financial year 2024–2025, losses due to UPI payment frauds reached Rs. 485 crore, compared to Rs. 1,087 crore in FY2023–2024, indicating some improvement in fraud control despite the higher transaction volumes.
According to data shared by the Ministry of Finance, over 6.32 lakh fraud cases were reported in the initial months of FY2024–2025. While UPI continues to drive India’s digital payment growth, the growing number of fraud incidents underscores the need for stronger security and user awareness measures.
Source: CNBC.
Number of Banks Live On UPI
As of January 2026, there are 691 banks participating in UPI, which shows a slight decrease from the 685 banks recorded in December 2025. This data indicates that the number of banks onboarded to UPI has been steadily increasing over the past few months, with minor fluctuations.
| Month | No. of Banks Live on UPI |
| January – 2026 | 691 |
| December – 2025 | 685 |
| November – 2025 | 684 |
| October – 2025 | 683 |
| September – 2025 | 686 |
| August – 2025 | 688 |
| July – 2025 | 684 |
| June – 2025 | 675 |
| May – 2025 | 673 |
| April – 2025 | 688 |
Source: NPCI
UPI Monthly Volume
In November 2025, UPI recorded 20.47 billion transactions, with a total transaction value of Rs. 26.32 lakh crore. The platform saw a strong YoY growth of 32% in transaction count and 22% growth in transaction value. On average, 682 million transactions were processed daily, with a daily transaction value of Rs. 87,721 crore.
December 2025 showed further growth. UPI processed 21.63 billion transactions, with a total value of Rs. 27.97 lakh crore. The year-on-year growth stood at 29% in transaction count and 20% in transaction amount. The average daily transaction volume increased to 698 million, and the daily transaction value rose to Rs. 90,217 crore.
| Month | Transaction Count | YOY Growth | Transaction Amount | YOY Growth | Avg. Daily Transactions | Avg. Daily Amount |
| Nov 2025 | 20.47 | 32% | 26.32 | 22% | 682 | 87,721 |
| Dec 2025 | 21.63 | 29% | 27.97 | 20% | 698 | 90,217 |
Source: Newsonair
Interesting UPI Facts You Might Not Know
Did you know that ₹1,000 is the most frequently transferred amount via UPI? Let’s dive into some more fascinating insights about India’s digital payment system.
A Single Bank Account Can Have Up to Four UPI IDs.
Users can generate multiple UPI IDs for the same bank account, especially through apps like Google Pay. While this doesn’t impact transaction processing, it provides alternative payment routes, reducing the chances of failed transactions.
Share of UPI in Digital Payments increased by 12x since 2018
Back in 2018, UPI only had a 6% market share in the digital payment sector in India. Now the technology’s share has increased to 73%. It’s also the most used digital payment now.
PhonePe Users Spend 35% More on Mondays Compared to Sundays.
Spending patterns indicate a sharp rise in transactions at the start of the workweek, likely after a weekend of relaxation and outings.
UPI helped increase digital payments by 7 times.
UPI was launched in 2016 and was able to increase the volume of digital payments in India by 7x by 2023. Its even greater now.
Over 37% of UPI Transactions Happen After 6 PM.
Evenings see a surge in UPI payments, especially in food and beverage outlets, as professionals unwind after work. Interestingly, around 10% of daily transactions take place between 7–8 PM alone.