
The iPhone continues to be a dominant brand in the smartphone market. With the launch of the iPhone 17 series, the brand has once again set new benchmarks for innovation, performance, and design. As of 2025, the iPhone has maintained its position as one of the most sold smartphones with over 1.5 billion active users worldwide.
Since 2007, the iPhone’s journey has been one of constant evolution. From iPhone 1 to the cutting-edge iPhone 17, Apple’s journey has been nothing short of revolutionary.
In this blog, we’ll explore the latest iPhone user and sales statistics in 2025. Let’s get into it, shall we?
iPhone Statistics 2025 – Top Picks
- Apple reported Q2 2025 revenue of $95.4 billion, marking a 5% YOY increase.
- Around 30% of smartphone users worldwide use an iPhone.
- iPhones own 57% of the smartphone market share in the United States.
- In 2025, iPhone users worldwide are expected to cross 1.56 billion.
- Since its 2007 release, Apple has sold over 2.6 billion iPhones globally.
How Many iPhones Are There?
There are 51 iPhone models released by Apple since the launch of the first iPhone in 2007. Over the years, Apple has continued to release new models, including the iPhone SE, Pro, Plus, Air, and mini versions, each offering advancements in design, features, and performance.
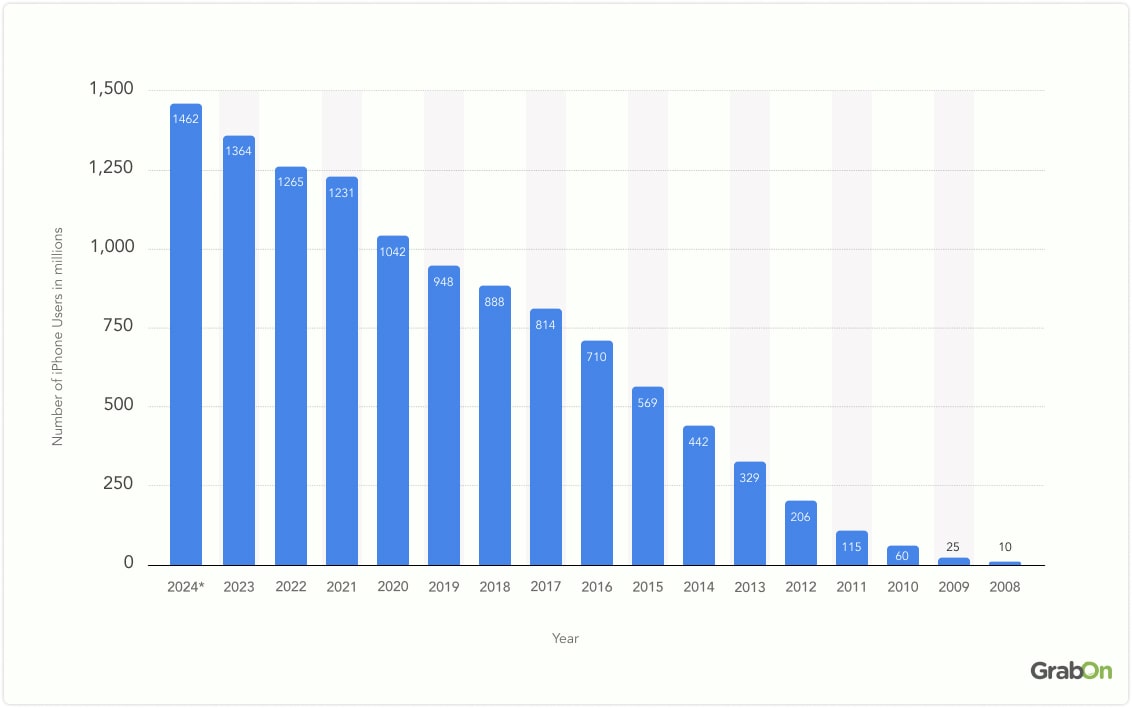
Number of iPhone Users Globally
There are 1.56 billion iPhone users in the world as of 2025, which is almost 20% of the global population.
| Year | Number of iPhone Users |
| 2025 | 1,560 million |
| 2024 | 1462 million |
| 2023 | 1364 million |
| 2022 | 1265 million |
| 2021 | 1231 million |
| 2020 | 1042 million |
| 2019 | 948 million |
| 2018 | 888 million |
| 2017 | 814 million |
| 2016 | 710 million |
| 2015 | 569 million |
| 2014 | 442 million |
| 2013 | 329 million |
| 2012 | 206 million |
| 2011 | 115 million |
| 2010 | 60 million |
| 2009 | 25 million |
| 2008 | 10 million |
- In the United States, iPhones account for approximately 50% of all smartphone users, while 70% of smartphone users in Japan use an iPhone.
- As the iPhone’s largest market, the U.S. houses one-fifth of the iPhone’s total number of active units worldwide.
(Source: Bankmycell, Statista)
Number of iPhone Users in India
As of 2025, over 14 million people use iPhones in India, representing approximately 8% of the total smartphone market in the country.
This marks a significant increase from previous years, driven by factors such as easy EMI options, local manufacturing, and aggressive pricing strategies. Apple has ramped up its production in India, with one in every five iPhones now being produced locally.
iPhone Revenue Statistics
- Apple announced its fiscal Q2 2025 results, reporting revenue of $95.4 billion, a 5% year-over-year increase, driven by strong iPhone sales and growth in its services segment.
- In Q3 2024, Apple’s iPhone revenue was approximately $39.3 billion. This represents a slight decrease from the revenue recorded in Q3 2023, which was $39.7 billion. Despite the decrease, Apple has maintained a relatively high level of iPhone revenue consistently, which indicates strong customer loyalty and the effectiveness of its ongoing product innovation strategy. Apple’s iPhone revenue tends to peak in Q4 of each fiscal year. This is due to new iPhone releases and holiday sales, after which there is typically a decline in Q1.
- Apple registered a revenue of $391.4 billion in 2024, which is a 2.02% increase from the previous year. Apple made its highest revenue in 2022 when the total reached $394.33 billion.
| Year | Apple Revenue |
| 2012 | $156.5 billion |
| 2013 | $170.9 billion |
| 2014 | $182.8 billion |
| 2015 | $233.72 billion |
| 2016 | $215.64 billion |
| 2017 | $229.23 billion |
| 2018 | $265.6 billion |
| 2019 | $260.17 billion |
| 2020 | $274.52 billion |
| 2021 | $365.82 billion |
| 2022 | $394.33 billion |
| 2023 | $383.29 billion |
| 2024 | $391.04 billion |
Apple’s revenue has grown 4x over the past decade, with the hardware segment remaining its most profitable division. Additionally, services like the iTunes Store, iCloud, and other digital offerings contribute significantly to the company’s revenue.
- Apple India achieved a remarkable revenue of ₹67,121.6 crore for the financial year ending March 2024, marking a 36% increase from the previous year, primarily due to a surge in iPhone sales.
(Source: Statista, Livemint, Apple, Apple 2025 report)
iPhone Market Share Globally
- iPhones claim a 30% share of global smartphone users. This means 3 in every 10 smartphone users globally have an iPhone.

iPhone Market Share in the US
iOS has a steady market share of 58.81% in the United States.
iOS Market Share in the US
| Year | iOS Market Share |
| 2009 | 57.90% |
| 2010 | 38.31% |
| 2011 | 38.33% |
| 2012 | 49.48% |
| 2013 | 52.79% |
| 2014 | 52.30% |
| 2015 | 50.85% |
| 2016 | 53.19% |
| 2017 | 53.89% |
| 2018 | 54.82% |
| 2019 | 55.23% |
| 2020 | 59.54% |
| 2021 | 58.58% |
| 2022 | 56.74% |
| 2023 | 58.10% |
| 2024 | 58.81% |
(Source: Counterpoint, Exploding Topics)
iPhone Market Share by Country
- iPhones hold a dominant market share in several developed countries. In Europe, Denmark leads with 64% of iPhone users, followed by Norway at 62%. Canada (58%) and Australia (57%) hold a strong iPhone presence. These numbers suggest a significant preference for iPhones among these countries’ populations, outperforming Android and other mobile phone brands.
iPhone Market Share Worldwide
| Country | iPhone Market Share |
| USA | 59.21% |
| Japan | 59.18% |
| Canada | 60.38% |
| Australia | 56.88% |
| United Kingdom | 50.81% |
| India | 8% |
(Source: World Population Review, India Today)
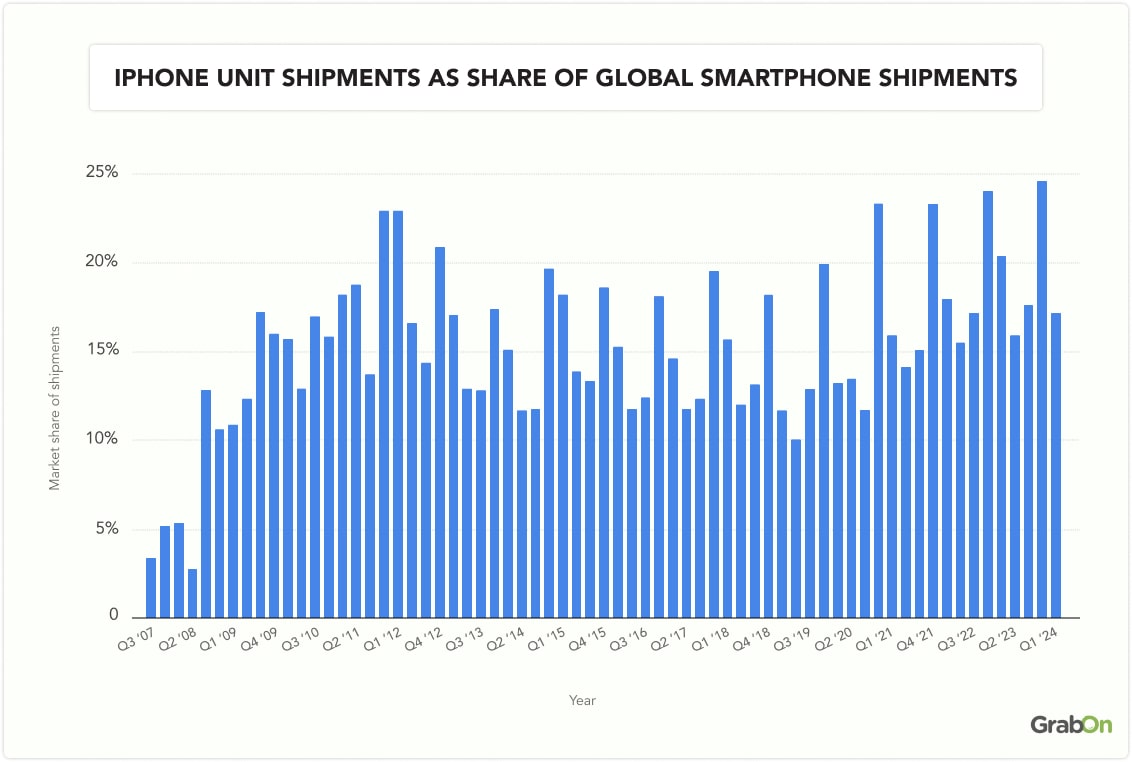
iPhone Market Share in Smartphone Shipments
- In Q2 2025, Apple shipped approximately 46.4 million iPhones, capturing around 15.7% of the global smartphone market share based on total worldwide shipments of 295.2 million units.
- Despite the solid shipment figures, Apple’s market share slightly dipped compared to the previous year due to slower demand in key markets and intensifying competition from Android brands like Samsung and Xiaomi.
- iPhones had a 17.3% market share among total smartphone shipments in the first quarter of 2024. iPhone shipments generally take a spike during the last quarter of every year as Apple unveils a new iPhone in September of every year.
Market share of iPhone sales worldwide
Apple iOS Market Share
- As of 2025, iOS holds about 26.9% of the mobile operating systems market.
While Apple maintains strong market penetration in North America, Western Europe, and Japan due to its brand loyalty, smooth ecosystem, and consistent software updates, its higher price points have limited growth in markets like India.
(Source: Procurri)
iPhone Sales by Year
- In the first half of FY 26 (April to September 2025), India’s smartphone exports reached $13.5 billion.
In September 2025 alone (when the new iPhone 17 series launched globally), smartphone exports from India were $1.8 billion, rising 95% year-on-year. - Apple surpassed 3 million units in 2025 Q1 shipments in India, marking its largest ever for this period.
The iPhone 16 series, especially the budget-friendly iPhone 16e, significantly contributed to this growth. These new models accounted for over half of all iPhone shipments during the quarter. - Over 2.82 billion iPhones were sold worldwide in the first three quarters of 2024. The sales of iPhones peaked in 2021 when the iPhone 13 was released. The model gained popularity with its advanced features and 5G capability, leading to a record-breaking 50% year-over-year jump in sales.
| Year | iPhone Units Sold |
| 2007 | 1.39 million |
| 2008 | 11.6 million |
| 2009 | 20.7 million |
| 2010 | 72.3 million |
| 2011 | 93.5 million |
| 2012 | 125 million |
| 2013 | 150.2 million |
| 2014 | 169.2 million |
| 2015 | 208.4 million |
| 2016 | 211.8 million |
| 2017 | 217.7 million |
| 2018 | 231.2 million |
| 2019 | 233.9 million |
| 2020 | 216.7 million |
| 2021 | 232.2 million |
| 2022 | 231.3 million |
| 2023 | 242 million |
| 2024(up to Q3) | 151.3 million |
- In Q4 2024, Apple shipped approximately 80 million iPhones globally. This period marked a strong holiday season for the brand, driven by high demand for the iPhone 15 and early sales of the new iPhone 16 series
- 1.39 million iPhone units were sold in the year of its release (2007).
- In 2021, iPhone sales generated a revenue of $192 billion, a significant rise from $137 billion in 2020.
- During the initial quarter of 2024, Apple achieved a milestone by shipping approximately 50 million iPhone units. This figure signifies a strong start to the year and the lasting demand for Apple’s flagship product.
(Source: Statista, Apple Insider, Global Data, ARS Technica, TOI)
iPhone Sales in India
Apple is expected to sell over 4.5 million units of the iPhone 17 series in India during the festive season of 2025, driven by both the base iPhone 17 and the higher-end Pro models.
iPhone shipments in India are projected to reach 14 – 15 million units by 2025, with the potential to rank among the top 5 smartphone brands. As of Q3 2024, Apple secured the 6th position, closely following Xiaomi.
(Source: IDC)
iPhone Sales by Model
In 2023, the iPhone 14 sold the most, with shipments of 34 million units, closely tailed by the iPhone 15 Pro Max with over 33 million units shipped.
| Model | Highest-Selling iPhone Units |
| iPhone (1st Generation) | 6.1 million (2007 to 2008) |
| iPhone 3G | 25 million in 2008 |
| iPhone 3GS | 35 million in 2009 |
| iPhone 4 | 50 million in 2010 |
| iPhone 4S | 60 million in 2011 |
| iPhone 5 | 70 million in 2012 |
| iPhone 5S | 52 million in 2013 |
| iPhone 6/6 Plus | 222.4 million in 2014 |
| iPhone 6s/6s Plus | 174.1 million in 2015 |
| iPhone 7/7 Plus | 159.9 million in 2016 |
| iPhone 8/8 Plus | 124.7 million in 2017 |
| iPhone X | 63 million in 2017 |
| iPhone XR | 77.4 million in 2018 |
| iPhone XS/XS Max | 48 million in 2018 |
| iPhone 11 | 102 million in 2019 |
| iPhone 11 Pro/Pro Max | 47.5 million in 2019 |
| iPhone SE (2nd generation) | 24.2 million in 2020 |
| iPhone 12 series | 100 million in 2020 |
| iPhone 13 series | 80 million in 2021 |
| iPhone 14 & 14 Pro Series | 29 million in 2022 |
| iPhone 14 Pro Max | 34 million in 2022 |
| iPhone 15 Pro | 21 million in 2023 |
| iPhone 15 | 17 million in 2023 |
| iPhone 16 | 100 million in 2024 |
| iPhone 17 | 84 million as of October 2025 |
(Source: Business Insider, Hindustan Times, Counterpoint, Wikipedia)
iPhone Usage Statistics
- The iPhone boasts over 1.36 billion active users globally, making it the most popular single smartphone brand.
- The trending app category in the App Store is Navigation with a 104.5% conversion rate.
- Google is the most popular non-gaming iPhone App publisher, whereas X-Hero is the leading gaming app by downloads worldwide.
- In the first quarter of 2023, iOS apps were downloaded 8.6 billion times, contributing to a yearly total of 32.6 billion downloads.
- On average, a user spends 40 hours on their iPhone per week, which is similar to 40 hours of a work week.
- iPhone is the most owned Apple device (88%), followed by iPad (73%), Apple Watch (58%), and Mac laptop/ desktop (50%).
- 92% of all iPhones run either the most recent iOS 16 (72%) or the preceding iOS 15 (20%).
(Sources: Enterprise Apps Today, MS Power User, Statista)
Apple Revenue Breakdown
- iPhone (52.33% Revenue): The iPhone remains Apple’s largest revenue generator, driven by strong sales of the latest models, including the iPhone 15 series. The continuous innovation in camera technology, performance, and design keeps the iPhone highly popular among consumers.
- Services (22.23% Revenue): This segment includes revenue from the App Store, Apple Music, iCloud, AppleCare, and other subscription services. The growth in services revenue is attributed to the expanding ecosystem of digital content and services, as well as increased adoption of subscription-based models.
- Wearables, Home, and Accessories (10.40% Revenue): This category covers products like the Apple Watch, AirPods, and HomePod. The popularity of these devices, especially the Apple Watch and AirPods, has contributed significantly to this segment’s growth.
- Mac (7.66% Revenue): Mac sales continue to be strong, supported by the introduction of new models with Apple’s M1 and M2 chips, which offer improved performance and efficiency.
- iPad (7.38% Revenue): The iPad remains a key product for Apple, with consistent demand from both consumers and educational institutions. The versatility and performance of the iPad, along with the introduction of new models, help maintain its market presence.
(Source: Apple)
Android Phone Vs. iPhone Market Share
- As of March 2025, Android holds a 94.81% market share in India, while iOS has 4.88%. In the US, iOS leads with a 57.36% market share, and Android has 42.38%.
- In the first quarter of 2024, Android held its position as the leading mobile operating system globally, capturing a 70.7 percent market share. Its nearest competitor, Apple’s iOS, accounted for 28.5 percent of the market during this period.
- In the US, iPhone has a 58.81% market share, while Android has a 40.81% market share.
The market share of iOS and Android in the USA has seen fluctuations due to several factors. Apple’s consistent innovation, strong brand loyalty, and ecosystem integration have helped maintain and slightly increase its market share. On the other hand, Android’s diverse range of devices caters to various price points, which also keeps it competitive.iOS Vs. Android Market Share in the US over the years
| Year | iOS | Android |
| 2009 | 57.90% | 6.16% |
| 2010 | 38.31% | 18.71% |
| 2011 | 38.33% | 35.32% |
| 2012 | 49.48% | 40.63% |
| 2013 | 52.79% | 39.25% |
| 2014 | 52.30% | 42.58% |
| 2015 | 50.85% | 46.42% |
| 2016 | 53.19% | 45.20% |
| 2017 | 53.89% | 45.23% |
| 2018 | 54.82% | 44.73% |
| 2019 | 55.23% | 44.51% |
| 2020 | 59.54% | 40.27% |
| 2021 | 58.58% | 41.11% |
| 2022 | 56.74% | 42.94% |
| 2023 | 58.10% | 41.46% |
| 2024 | 58.81% | 40.81% |
(Source: Statista, StatCounter, Sciflare)
Interesting iPhone Facts
The iPhone has revolutionized communication, entertainment, and work, becoming integral to modern life. As we explore 2024, the iPhone continues to surprise and impress with its technology and design. From its inception as Steve Jobs’s “computer in a book” vision to the latest iPhone features, here are some interesting facts to highlight the iPhone’s impact on the smartphone industry.
- How many iPhones are sold in a day?
Apple sold 231.8 million iPhone units, which means around 635,068 iPhones were sold daily in 2023.
- How many iPhones are sold per year?
In the year 2023, Apple shipped 231.8 million iPhones worldwide.
- How many iPhones have been sold since 2007?
Over 2.6 billion iPhones have been sold worldwide since its launch in 2007.
- What is the percentage of iPhone users in the US?
As of 2024, the percentage of smartphone users in the United States using an iPhone is 61.3%. This significant market share reflects the strong preference for iPhones in the US, around triple the global market share of iPhone users (23%). - When did iPhones come out?
The first iPhone was announced by Steve Jobs on January 9, 2007, and it was released on June 29, 2007. - What is the most recent iPhone?
The most recent iPhone as of October 2025 is the iPhone 17 series, which launched in September 2025. This series includes the iPhone 17, iPhone 17 Pro, iPhone 17 Pro Max, and the newer iPhone Air 2 model. - How much is the iPhone 1?
The original iPhone, released in 2007, was priced at $499 for the 4GB model and $599 for the 8GB model. Today, it’s considered a collector’s item, and prices can vary significantly based on condition and whether it’s still in its original packaging. - Why does Apple often display the time 9:41 AM in its ads?
The time 9:41 AM is a tribute to the original iPhone’s introduction by Steve Jobs, which occurred at that exact time. - Is there an iPhone 18?
Currently, there is no official release of a standard iPhone 18 model yet. According to industry reports and leaks, Apple may delay the launch of the base iPhone 18 until early 2027.