
India’s aviation market is now worth $14.78 billion, with an estimated reach of over $26 billion by 2030. As the third-largest domestic aviation market globally, India processed 174 million passengers in 2024 and continues expanding at rates that outpace most developed economies.
We have compiled a detailed statistical picture of India’s aviation market in this post, where we cover areas like airline market share, Number of flights, and passengers, and more.
Let’s get to it without further due.
Indian Aviation Market Size
The Indian aviation market stands at $16.56 billion in 2026, with projections pointing toward $26.08 billion by 2030, a compound annual growth rate (CAGR) of 12.03%.
| Year | Market Size |
| 2025 | $14.78 billion |
| 2026 | $16.56 billion |
| 2027 | $18.54 billion |
| 2028 | $20.75 billion |
| 2029 | $23.21 billion |
| 2030 | $26.08 billion |
Commercial aviation dominates the sector, accounting for 85.80% of the total market value. Military aviation, while smaller, is experiencing faster growth driven by defense modernization programs and domestic aircraft production initiatives like the Tejas LCA program.
The aviation sector contributes $53.6 billion to India’s GDP and supports 7.7 million jobs across direct employment, supply chains, and tourism-dependent sectors. Domestic travel makes up 80% of air traffic, though international segments are growing faster percentage-wise.
Between FY20 and FY25, India’s aviation infrastructure received over Rs. 96,000 crore (US$ 11.2 billion) in capital expenditure through the Airports Authority of India and public-private partnerships. The government has announced plans to invest an additional US$ 1.83 billion for airport development and aviation navigation services by 2026.
Source: Mordor Intelligence, IMARC Group, IBEF, IATA
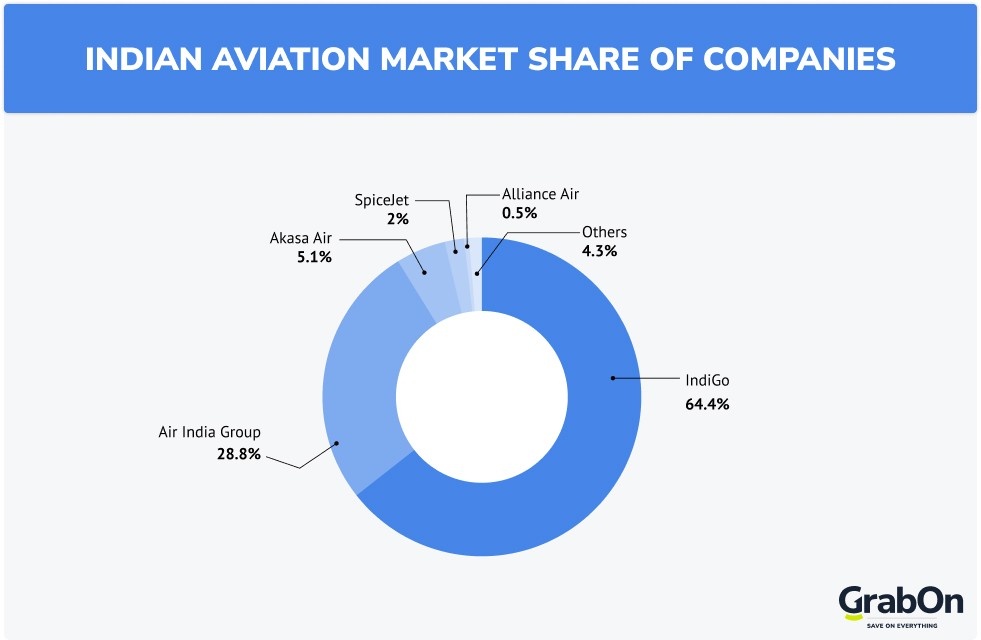
Indian Aviation Market Share of Companies
| Airline | Market Share | Seats (As of Q1 CY 2026) |
| IndiGo | 63.3% | 276.93 lakhs |
| Air India Group | 26.5% | 116.02 lakhs |
| Akasa Air | 5.0% | 21.97 lakhs |
| SpiceJet | 3.9% | 16.87 lakhs |
| Alliance Air | 0.5% | 2.03 lakhs |
IndiGo’s 63.3% market share represents an extraordinarily dominant position for a single carrier. The airline’s capacity in Q1 CY2026 reached 276.93 lakh passengers, growing approximately 4–5% year-over-year. IndiGo’s low-cost model, extensive domestic network, and aggressive international expansion have made it India’s undisputed market leader.
Air India and Air India Express, both under the Tata Group umbrella following the November 2024 Vistara merger, collectively hold approximately 26.5% market share. While Air India’s capacity appears to have grown by 42% (1.1 million additional seats) in October 2025 compared to last year, when combined with Vistara capacity from October 2024, overall capacity decreased by 14%, reflecting merger-related fleet rationalization.
Air India Express continues aggressive expansion with 25% year-over-year growth, positioning itself in the budget segment while maintaining connectivity to both domestic and international destinations.
SpiceJet, despite operational challenges and financial constraints, holds 3.9% market share in Q1 CY2026 with 16.87 lakh passengers carried. The carrier’s turnaround efforts appear to be gaining traction.
Akasa Air, the newest major entrant launched in 2022, has captured 5.0% market share with approximately 21.97 lakh passengers in Q1 CY2026. The airline’s swift expansion demonstrates continued opportunities in India’s undersupplied aviation market.
Market Share By Low-Cost vs. Full-Service Carriers
Low-cost carriers dominate the Indian market, holding 71% of total capacity, that’s an increase of 3.2% compared to May 2025. Low-cost capacity stands at 18.3 million seats, while full-service capacity totals 7.4 million seats.
Full-service airline capacity declined by 6.9% year-over-year, now accounting for 29% of the Indian market. This shift reflects broader global trends toward budget travel and the success of hybrid models that offer à la carte services.
Source: OAG, Ministry of Civil Aviation, DGCA
Number of Indian Domestic Flights
India’s domestic flight operations have experienced explosive growth post-pandemic, with 2025 marking new records across operational metrics.
Historical Domestic Flight Growth
Domestic flight numbers grew from 48,100 monthly flights (median) during 2001-2025 to peak levels exceeding 102,000 flights in March 2025. The pandemic created a historic low of just 188 flights in April 2020, making the recovery trajectory even more remarkable.
Between April-December 2024, over 122.5 million domestic passengers traveled by air, up 7% year-over-year and nearly 13% higher than the April-December 2019 period. Domestic traffic for FY24-FY25 (first 11 months) reached 155.1 million passengers, up 7.7% from the previous year and 12.9% higher than pre-COVID levels.
CY2026 Monthly Domestic Passenger Data (DGCA)
| Month | Passengers Carried (Lakhs) | YoY Growth |
| January 2026 | 152.49 | +4.36% |
| February 2026 | 140.66 | +0.16% |
| March 2026 | 144.16 | -0.87% (MoM) |
| April 2026 | 138.18 | -3.47% (MoM) |
| Q1 CY2026 Total | 437.31 | +1.23% YoY |
| Jan to Apr 2026 Total | 575.49 | +0.06% YoY |
Note: YoY growth has decelerated sharply in CY2026 — from +4.36% in January to near-flat +0.06% cumulative through April — compared to 7–10% growth seen in FY2025. This reflects a combination of high base effects and macroeconomic softness.
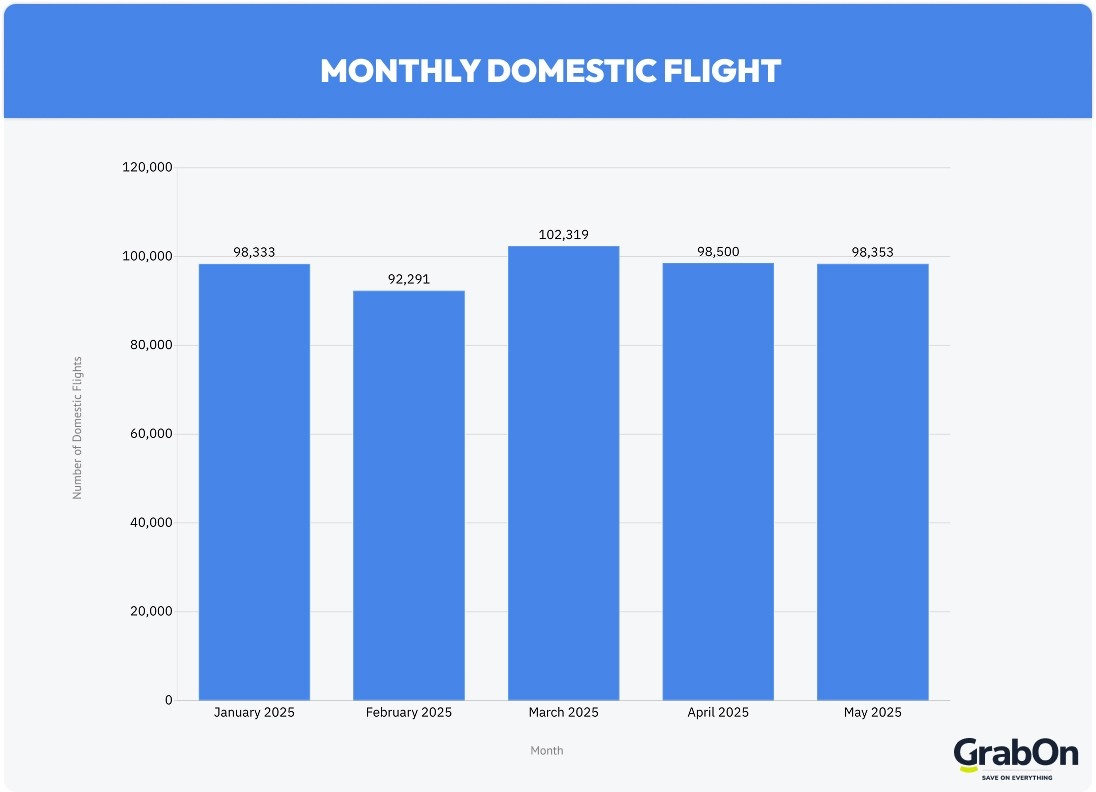
2025 Monthly Domestic Flight Data
| Month | Number of Domestic Flights | Year-on-Year Change |
| January 2025 | 98,333 | +15% |
| February 2025 | 92,291 | +12% |
| March 2025 | 102,319 | +18% (Record High) |
| April 2025 | 98,500 | +10% |
| May 2025 | 98,353 | +5.1% |
March 2025 set an all-time record with 102,319 domestic flights, surpassing all previous monthly totals since data collection began in 2001. This translates to approximately 3,300 daily domestic departures, a staggering operational tempo requiring sophisticated air traffic management.
May 2025 saw 143.6 lakh (14.36 million) passengers flying domestically, up 4.1% year-over-year from 138 lakh in May 2024. However, month-on-month growth flattened compared to April 2025, suggesting seasonal patterns rather than continuous acceleration.
The average number of passengers per flight stood at 146 in May 2025, marginally down from 147 in May 2024. Passenger Load Factor (PLF) reached 88.0% in May, down from 88.9% the previous year but up from 86.1% in April 2025.
ICRA forecasts domestic passenger traffic will grow 7-10% in FY2026, reaching 175-181 million passengers, following a 7.6% rise in FY2025. Despite steady demand, the industry faces potential net losses of Rs 20,000-30,000 crore in FY2026 due to cost pressures, higher lease liabilities, and interest expenses.
Source: DGCA, CEIC Data, ICRA, Ministry of Civil Aviation
Number of Airports in India
India’s airport infrastructure has expanded dramatically, transforming regional connectivity and enabling air travel penetration into smaller cities.
Current Airport Infrastructure
As of November 2025, India operates 163 airports across the following categories:
| Airport Type | Number | Details |
| Total Operational | 163 | All categories combined |
| International | 33 | Including JV airports |
| Custom Airports | 12 | Designated for international operations |
| Domestic | 118 | Including State Govt/Private airports |
| Joint Venture International | 7 | PPP model airports |
| State Govt/Private | 20 | Non-AAI operated |
This represents a massive expansion from just 74 airports in 2014 to 162-163 as of September-November 2025, more than doubling the network in eleven years. The government aims to reach 220 operational airports by 2025, requiring approximately 57-60 additional airports in the coming months.
UDAN Regional Connectivity Scheme
The UDAN (Ude Desh ka Aam Nagrik) scheme has been instrumental in expanding regional connectivity:
- 92 airports are operational under UDAN (including 15 heliports and 2 water aerodromes)
- 637 routes have been operationalized as of August 31, 2025
- 10 operators participate in the scheme
- 3.19 lakh flights have been operated
- 155.19 lakh passengers have traveled under UDAN till August 31, 2025
- Rs 4,222 crores in Viability Gap Funding has been allocated
The scheme specifically targets underserved and unserved airports, bringing air connectivity to Tier 2 and Tier 3 cities that previously lacked commercial aviation services. This democratization of air travel has significantly contributed to India’s aviation growth.
Upcoming Airport Expansions
Several major airport projects are in various stages of development:
Noida International Airport (Jewar) – Set to become India’s largest airport by area with over 7,000 acres, expected to ease congestion at Delhi’s IGI Airport
Navi Mumbai International Airport – Opened in December 2025, with a 3,700m runway capable of handling Code 4F aircraft. Now operational and ranked as the 9th busiest domestic airport in India as of May 2026. The airport aims to expand Mumbai’s passenger capacity from 5 crore to 15 crore annually.
Mopa International Airport, Goa – Operational since 2023, covering 2,132 acres with current capacity of 4.4 million passengers annually, expanding to 13.1 million by 2026
Source: Ministry of Civil Aviation, DGCA, UDAN Scheme Data
Busiest Airports in India
India’s busiest airports handle millions of passengers monthly, with Delhi maintaining its position as the nation’s primary aviation hub.
Top 10 Busiest Airports by Domestic Passenger Traffic (November 2025)
| Rank | Airport | Monthly Seats | YoY Growth |
| 1 | Indira Gandhi International Airport, Delhi | 3.1 million | +11% |
| 2 | Kempegowda International Airport, Bengaluru | 1.98 million | n/a |
| 3 | Chhatrapati Shivaji Maharaj International Airport, Mumbai | 1.98 million | n/a |
| 4 | Rajiv Gandhi International Airport, Hyderabad | 1.1 million | -9% |
| 5 | Chennai International Airport | 0.85 million | +7% |
| 6 | Netaji Subhas Chandra Bose International Airport, Kolkata | 0.72 million | -6% |
| 7 | Sardar Vallabhbhai Patel International Airport, Ahmedabad | 0.68 million | +14% |
| 8 | Cochin International Airport | 0.52 million | +4% |
| 9 | Navi Mumbai International Airport (NMI) | 0.5 million | New entrant |
| 10 | Pune Airport | 0.48 million | +9% |
Delhi (DEL) stands as India’s busiest airport for domestic flights with 3.1 million seats in May 2026, maintaining its lead with 11% year-over-year growth.
Bengaluru (BLR) and Mumbai (BOM) airports are now jointly ranked second, each with 1.98 million seats in May 2026 (up from 1.88M and 1.87M respectively). This tight competition reflects the economic importance of both cities, Bengaluru as India’s tech capital and Mumbai as its financial hub.
Ahmedabad (AMD) posted the highest percentage growth at 14% compared to last year, reflecting Gujarat’s expanding economy and improved connectivity. Conversely, capacity decreased at Goa (GOI) by 10% and Kolkata (CCU) by 6%, likely due to new airport openings (Mopa in Goa) and economic shifts.
Navi Mumbai International Airport (NMI), which opened in December 2025, has rapidly become the 9th busiest domestic airport in India as of May 2026 (per OAG data).
Busiest States by Airline Capacity (November 2025)
| Rank | State | Monthly Seats (Million) | Market Share | YoY Change |
| 1 | Delhi | 4.2 | 20% | +10% |
| 2 | Maharashtra | 4.0 | 19% | n/a |
| 3 | Karnataka | 2.4 | 11.3% | +8% |
| 4 | Tamil Nadu | 1.5 | 7.1% | +6% |
| 5 | Telangana | 1.2 | 5.7% | -9.2% |
| 6 | Gujarat | 1.0 | 4.7% | +13% |
| 7 | Rajasthan | 0.599 | 2.8% | +26.9% |
| 8 | Kerala | 0.87 | 4.1% | -35% |
Delhi leads with 4.2 million seats and 20% of India’s total market share, reflecting its dual role as national capital and major international gateway. Maharashtra has moved up significantly to 4.0 million seats (19% share), driven primarily by Mumbai’s dominance and the new Navi Mumbai airport.
Rajasthan recorded the fastest capacity growth at 26.9% year-over-year to 599,000 seats, reflecting tourism growth and improved connectivity to Jaipur, Udaipur, and Jodhpur. Kerala saw a steep 35% decline versus last year, largely driven by reduced capacity to the Middle East, a key market for this region.
Source: OAG, DGCA, Airports Authority of India
Biggest Airports in India (By Area)
Size matters in aviation infrastructure, larger airports provide space for multiple runways, expanded terminals, cargo facilities, and future growth. Here are India’s largest airports ranked by total land area.
Top 10 Largest Airports by Area
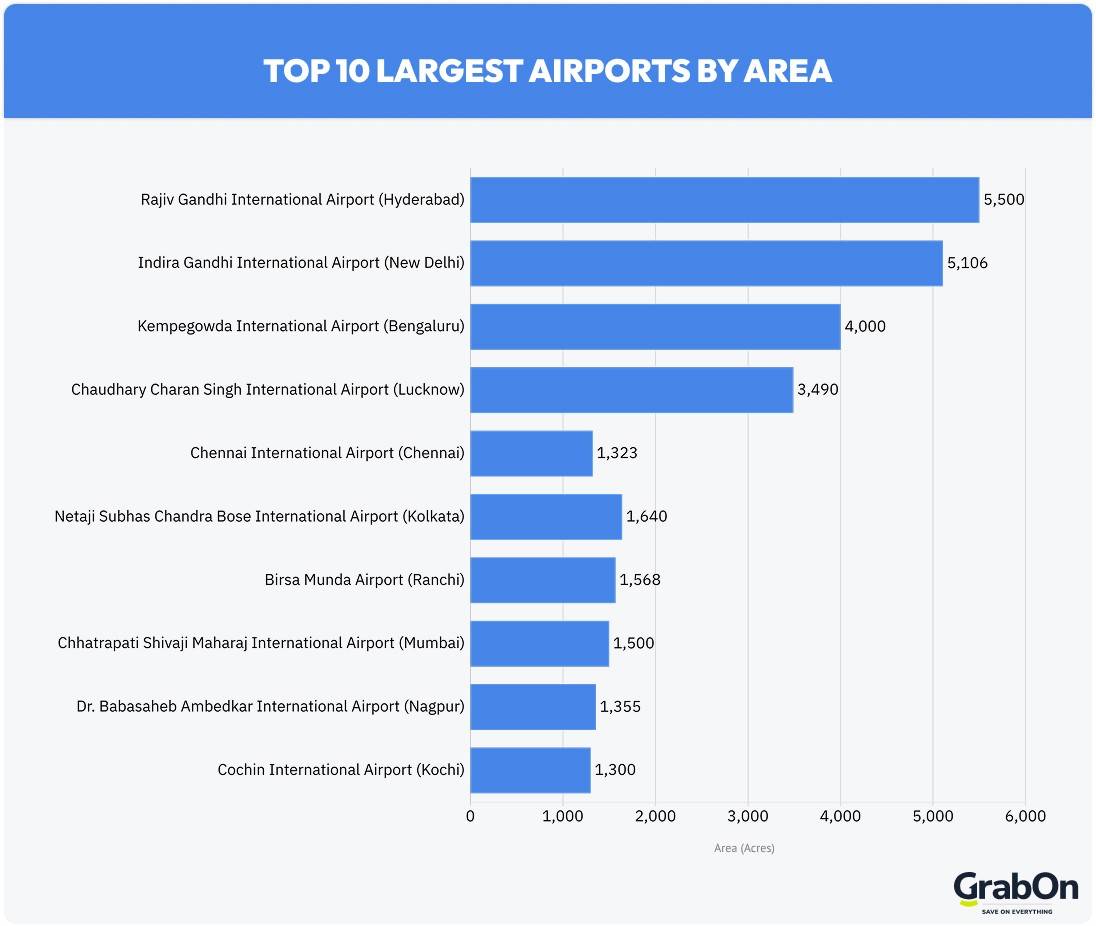
| Rank | Airport | Location | Area (Acres) | Terminals | Runways |
| 1 | Rajiv Gandhi International Airport | Hyderabad | 5,500 | 1 (Integrated) | 2 |
| 2 | Indira Gandhi International Airport | New Delhi | 5,106 | 3 | 3 |
| 3 | Kempegowda International Airport | Bengaluru | 4,000 | 2 | 2 |
| 4 | Chaudhary Charan Singh International Airport | Lucknow | 3,490 | 1 | 1 |
| 5 | Chennai International Airport | Chennai | 1,323 | 4 | 2 |
| 6 | Netaji Subhas Chandra Bose International Airport | Kolkata | 1,640 | 2 | 2 |
| 7 | Birsa Munda Airport | Ranchi | 1,568 | 1 | 1 |
| 8 | Chhatrapati Shivaji Maharaj International Airport | Mumbai | 1,500 | 2 | 2 |
| 9 | Dr. Babasaheb Ambedkar International Airport | Nagpur | 1,355 | 3 | 2 |
| 10 | Cochin International Airport | Kochi | 1,300 | 4 | 1 |
Rajiv Gandhi International Airport, Hyderabad, reigns as India’s largest airport by area at 5,500 acres. Opened on March 23, 2008, it was the first airport in India to introduce domestic e-boarding (December 2015) and international e-boarding (October 2020). Despite its massive size, it ranks fourth in passenger traffic, handling over 25 million passengers annually. The airport is operated by GMR Hyderabad International Airport Limited (GHIAL) and serves as a hub for Alliance Air, Amazon Air, Blue Dart Aviation, SpiceJet, and IndiGo.
Indira Gandhi International Airport, New Delhi takes second place with 5,106 acres and maintains its position as India’s busiest airport. With three terminals and three runways, it handles approximately 70 million passengers annually (pre-pandemic figures exceeded 60 million). The airport uses advanced Airport Collaborative Decision Making (A-CDM) systems for managing takeoffs and landings.
Kempegowda International Airport, Bengaluru spans 4,000 acres and is India’s first solar-powered airport in Karnataka, developed by CleanMax Solar. It handles over 37.5 million passengers annually, making it the third-busiest airport behind Delhi and Mumbai. The airport serves as a hub for Air India, AIX Connect, Akasa Air, Alliance Air, and Vistara.
Chaudhary Charan Singh International Airport, Lucknow holds the fourth position with 3,490 acres, supporting Uttar Pradesh’s growing aviation needs and serving as a gateway to Buddhist circuit destinations.
Mumbai’s Chhatrapati Shivaji Maharaj International Airport, despite ranking eighth by area at 1,500 acres, handles the second-highest passenger traffic in India. The airport holds the world record for the most aircraft movements on a single runway, up to 51 takeoffs and landings per hour, nearly one every 70 seconds. Terminal 2’s roof design is inspired by the dancing peacock, India’s national bird, and the airport houses the world’s largest public art program within an airport, featuring over 7,000 pieces collectively named “Jaya He.”
Cochin International Airport distinguishes itself as the first airport in India to be fully powered by solar energy, despite its relatively modest 1,300-acre footprint. The airport’s commitment to sustainability has made it a global benchmark for green aviation infrastructure.
Upcoming Large-Scale Airports
Noida International Airport (Jewar) in Uttar Pradesh will become India’s largest airport upon completion, surpassing even Hyderabad. The airport is designed to handle massive passenger and cargo volumes while easing congestion at Delhi’s IGI Airport.
Source: Aviation A2Z, Current Affairs, PropertyPistol, HexaHome
Number of International Flights in India
International flight operations have rebounded strongly from pandemic lows, with 2025 marking a complete recovery and expansion beyond 2019 levels.
Historical International Flight Growth
International flight numbers grew from 7,797 monthly flights (median) during 2001-2025 to peak levels exceeding 18,500 flights in early 2025. The pandemic created a devastating low of just 273 flights in May 2020.
In FY24, international passengers totaled 69.6 million out of 376 million total passengers across Indian airports, representing approximately 18.5% of total traffic. International traffic in FY24 grew 15% compared to 2023 and reached almost 20% above 2019 pre-pandemic levels.
For the first 10 months of FY25 (April-January), Indian carriers transported approximately 280.9 lakh (28.09 million) international passengers, reflecting 14.8% year-on-year growth and 41.3% higher than pre-COVID levels of approximately 198.8 lakh passengers.
2025 Monthly International Flight Data
| Month | Number of International Flights | Year-on-Year Change |
| January 2025 | 18,574 | +22% (Record High) |
| February 2025 | 16,668 | +18% |
| March 2025 | 18,502 | +20% |
January 2025 set the all-time record with 18,574 international flights, surpassing all previous monthly totals since data collection began in 2001. March 2025 nearly matched this level with 18,502 flights, confirming sustained high-capacity operations.
International Capacity Split (May 2026)
Domestic capacity accounts for 71% of all seats, with international capacity making up the remaining 29%. Overall capacity decreased by 0.1%, with international capacity decreasing by 10.5% and domestic capacity increasing by 5.1%. This reflects the reduction in major Middle Eastern markets to/from India.
Top 10 International Country Markets from India
| Rank | Country | Monthly Seats | Market Share | YoY Growth |
| 1 | United Arab Emirates | 1.2 million | 27% | +2% |
| 2 | Thailand | 361,000 | 8% | +12% |
| 3 | Saudi Arabia | 307,200 | 7% | n/a |
| 4 | Singapore | 282,400 | 7% | n/a |
| 5 | Malaysia | 180,000 | 4.5% | +12% |
| 6 | United Kingdom | 165,000 | 4% | +6% |
| 7 | Sri Lanka | 140,000 | 3.5% | +4% |
| 8 | Nepal | 120,000 | 3% | +15% |
| 9 | United States | 110,000 | 2.7% | +8% |
| 10 | Qatar | 105,000 | 2.6% | +7% |
The United Arab Emirates remains India’s busiest international market with 1.2 million seats and 27% market share. Capacity is 2% higher in March 2026 compared to last year. The UAE-India corridor serves business travelers, Indian expatriate workers, and tourists, with Dubai and Abu Dhabi functioning as major transit hubs for onward connections to Europe, Africa, and Americas.
Thailand is the second busiest international market, with capacity growing 12% over the past year to 361,000 seats (8% market share). Thailand’s popularity as a tourist destination for Indian travelers has driven this dramatic expansion, with Bangkok and Phuket being primary destinations.
Singapore and Saudi Arabia have swapped positions — Saudi Arabia is now third with 307,200 seats and Singapore fourth with 282,400 seats (7% share each). Singapore serves as a premium business and transit destination, while Saudi Arabia caters to Hajj pilgrims, expatriate workers, and business connections.
Top 10 International Country Markets from India
| Rank | Country | Monthly Seats | Market Share | YoY Growth |
| 1 | United Arab Emirates | 1.1 million | 27% | +3% |
| 2 | Thailand | 358,000 | 9% | +22% |
| 3 | Singapore | 279,200 | 7% | +8% |
| 4 | Saudi Arabia | 278,700 | 7% | +5% |
| 5 | Malaysia | 180,000 | 4.5% | +12% |
| 6 | United Kingdom | 165,000 | 4% | +6% |
| 7 | Sri Lanka | 140,000 | 3.5% | +4% |
| 8 | Nepal | 120,000 | 3% | +15% |
| 9 | United States | 110,000 | 2.7% | +8% |
| 10 | Qatar | 105,000 | 2.6% | +7% |
The United Arab Emirates remains India’s busiest international market with 1.1 million seats and 27% market share. Capacity is 3% higher in November 2025 compared to last year. The UAE-India corridor serves business travelers, Indian expatriate workers, and tourists, with Dubai and Abu Dhabi functioning as major transit hubs for onward connections to Europe, Africa, and Americas.
Thailand is the second busiest international market, with capacity growing 22% over the past year to 358,000 seats (9% market share). Thailand’s popularity as a tourist destination for Indian travelers has driven this dramatic expansion, with Bangkok and Phuket being primary destinations.
Singapore and Saudi Arabia compete for third and fourth positions with 279,200 and 278,700 seats respectively (7% share each). Singapore serves as a premium business and transit destination, while Saudi Arabia caters to Hajj pilgrims, expatriate workers, and business connections.
Top 10 Busiest International Routes from India
| Rank | Route | Monthly Seats | YoY Change | Primary Airlines |
| 1 | Mumbai to Dubai | 237,000 | -2% | Emirates, Air India, IndiGo |
| 2 | Delhi to Dubai | 207,000 | n/a | Emirates, Air India, IndiGo |
| 3 | Delhi to London Heathrow | 176,000 | +5% | British Airways, Air India, Virgin Atlantic |
| 4 | Delhi to Kathmandu | 95,000 | +29% | Air India, IndiGo, Nepal Airlines |
| 5 | Mumbai to London Heathrow | 88,000 | +28% | British Airways, Air India |
| 6 | Bengaluru to Dubai | 82,000 | +4% | Emirates, IndiGo, Air India Express |
| 7 | Chennai to Colombo | 65,000 | +8% | Air India Express, IndiGo, SriLankan Airlines |
| 8 | Delhi to Singapore | 62,000 | +6% | Singapore Airlines, Air India, IndiGo |
| 9 | Mumbai to Singapore | 58,000 | +7% | Singapore Airlines, Air India, Vistara |
| 10 | Delhi to Abu Dhabi | 55,000 | +9% | Etihad Airways, Air India |
Mumbai-Dubai remains India’s busiest international route 237,000 seats, capacity reduced 2% versus March 2025. Despite the slight decline, this route represents the strongest single international connection from India, driven by business ties, tourism, and the large Indian diaspora in Dubai.
Delhi-London Heathrow ranks third with 176,000 seats, up 5% year-over-year. Historic ties, a large Indian diaspora in the UK, and strong business travel links maintain high frequency on this intercontinental route. Air India and British Airways both operate widebody aircraft with multiple daily departures.
Delhi-Kathmandu saw the fastest growth rate, increasing 29% year-over-year. This Indo-Nepal connection is driven by tourism, religious pilgrimage (particularly Pashupatinath), student migration, and robust bilateral relations. Low fares and short flight duration (under two hours) ensure high frequency.
Chennai-Colombo recorded 8% growth, reflecting geographic proximity and ethnic connections. A considerable Tamil population in Sri Lanka and religious pilgrimages in both directions provide year-round demand.
ICRA projects international passenger traffic for Indian carriers will grow 15-20% annually in FY2025 and FY2026, significantly outpacing domestic growth of 7-10%. This reflects India’s increasing integration with global trade networks, expanding business ties, and growing outbound tourism.
Source: DGCA, CEIC Data, OAG, ICRA, Aviation A2Z
Passenger Load Factor and On-Time Performance
Operational metrics provide insight into airline efficiency and customer experience quality across Indian carriers.
Passenger Load Factor
Passenger Load Factor
(Updated to Q1 CY2026 — DGCA Monthly Traffic Reports)
| Airline | Jan 2026 | Feb 2026 | Mar 2026 | Apr 2026 | Performance Assessment |
| Akasa Air | 93.2% | 93.3% | 90.5% | 91.8% | Highest efficiency |
| SpiceJet | 85.9% | 89.0% | 82.8% | 80.7% | Declined significantly from 93.3% |
| Air India Group | 86.5% | 88.3% | 82.3% | 78.5% | Declining trend |
| IndiGo | 87.7% | 89.6% | 83.5% | 82.7% | Strong demand management |
| Alliance Air | 64.8% | 65.8% | 60.6% | 61.1% | Regional connectivity focus |
Akasa Air leads with 93.2–93.3% PLF in Jan–Feb 2026, followed by IndiGo at 87.7–89.6%. These high load factors suggest strong demand management and pricing optimization. SpiceJet’s PLF has declined from 93.3% (Oct 2025) to 80.7% (Apr 2026), a concerning trend. Alliance Air’s sub-65% PLF reflects its mission-focused role in regional connectivity under the UDAN scheme, where routes prioritize accessibility over profitability.
On-Time Performance
(Updated — DGCA Monthly Traffic Reports, major airports)
| Airline | Jan 2026 | Feb 2026 | Mar 2026 | Apr 2026 |
| IndiGo | 70.9% | 80.1% | 88.7% | 88.5% |
| Akasa Air | 59.8% | 70.2% | 82.6% | 82.4% |
| Air India Group | 69.6% | 71.0% | 78.0% | 82.4% |
| SpiceJet | 56.8% | 50.9% | 43.0% | 31.2% |
| Alliance Air | 66.9% | 68.3% | 62.9% | 71.2% |
IndiGo leads OTP at 88.5% (April 2026), a significant improvement over Jan 2026 (70.9%) — the earlier weakness was largely attributable to weather disruptions. SpiceJet’s OTP has collapsed from 65.1% (Nov 2025) to 31.2% (Apr 2026), raising serious reliability concerns. Air India Group and Akasa Air show improvement trends through Q1 2026.
Source: Ministry of Civil Aviation, DGCA
Top Domestic Routes in India
India’s busiest domestic routes connect the nation’s economic powerhouses, with Delhi serving as the central hub.
Top 10 Domestic Routes
| Rank | Route | Monthly Seats | YoY Change | Flight Time |
| 1 | Mumbai to Delhi | 665,700 | -2% | 2h 10m |
| 2 | Bengaluru to Delhi | 524,000 | +15% | 2h 50m |
| 3 | Bengaluru to Mumbai | 410,000 | +5% | 1h 45m |
| 4 | Delhi to Kolkata | 330,000 | +8% | 2h 20m |
| 5 | Delhi to Hyderabad | 295,000 | +10% | 2h 15m |
| 6 | Delhi to Chennai | 285,000 | +12% | 2h 45m |
| 7 | Mumbai to Chennai | 241,000 | +20% | 2h |
| 8 | Delhi to Ahmedabad | 210,000 | +13% | 1h 40m |
| 9 | Mumbai to Hyderabad | 195,000 | +7% | 1h 30m |
| 10 | Delhi to Pune | 180,000 | +11% | 2h 10m |
Mumbai-Delhi remains India’s busiest domestic route with 665,700 seats, though capacity decreased 2% versus November 2024. This slight decline likely reflects route maturation and airline capacity redeployment to faster-growing markets. The route connects India’s financial capital with its political capital, serving business travelers, government officials, and tourists.
Bengaluru-Delhi ranks second with 524,000 seats, up 15% year-over-year. This route links India’s tech hub with the national capital, driven by IT industry travel, startups seeking government interactions, and general tourism. The strong growth reflects Bengaluru’s expanding economy and population.
Mumbai-Chennai saw the largest percentage increase at 20%, adding capacity to 241,000 seats and making it the seventh busiest domestic route. This growth connects two major southern economic centers and reflects increasing regional business integration.
Six of India’s top ten busiest domestic routes start from Delhi, underscoring its role as the nation’s primary aviation hub. The capital’s geographic centrality and political importance make it the natural connection point for north-south and east-west travel.
Source: OAG, DGCA
Cargo and Freight Operations
Air cargo plays a crucial role in India’s supply chain, particularly for time-sensitive goods, pharmaceuticals, and perishables.
Daily Cargo Operations (Recent Data)
| Category | Daily Volume (MT) | Trends |
| International Inbound | 47 | Trade imports |
| International Outbound | 293 | Export-driven |
| Domestic Inbound | 87 | Distribution |
| Domestic Outbound | 32 | Collection hubs |
| Total International | 340 | Growing 8-12% annually |
| Total Domestic | 119 | Steady growth |
International outbound cargo at 293 MT daily far exceeds inbound at 47 MT, reflecting India’s export-oriented manufacturing sector, particularly pharmaceuticals, gems & jewelry, and electronics. Major export destinations include the Middle East, Europe, and North America.
Krishi UDAN Initiative
The Krishi UDAN scheme focuses on air transportation of agricultural products:
- 58 airports participate in the scheme
- 4,740 MT of perishable cargo transported
- 21,330 MT of other agricultural products
- 26,070 MT total cargo moved under the initiative
Krishi UDAN addresses the critical need for rapid transport of perishable items like fruits, vegetables, flowers, and seafood from production centers to consumption markets. This reduces wastage and improves farmer incomes by enabling access to premium markets.
India’s air cargo sector is expected to grow 23% annually driven by e-commerce expansion, particularly in Tier 2 and Tier 3 cities where express delivery services are proliferating.
Source: Ministry of Civil Aviation, DGCA
Fleet Size and Aircraft Orders
India’s aircraft fleet is expanding rapidly to meet surging demand, with massive orders placed by major carriers.
As of 2024, India’s operational fleet consists of more than 860 aircraft, accounting for approximately 2.4% of the total global fleet. IndiGo and Air India have placed significant aircraft orders:
- IndiGo: 500 aircraft approved for import during 2023-2035, including a recent order for 30 A350-900 widebody aircraft to support international expansion
- Air India: 470 aircraft approved for import during 2023-2035, including 34 A350-900/1000 variants to upgrade long-haul fleet
India will require over 2,200 aircraft by 2042