
Did you know that streaming services surpassed the viewership of both broadcast and cable television? According to recent Nielsen research from 2025, streaming accounted for 44.8% of all TV usage, whereas cable and broadcast television captured only 24.1% and 20.1%, respectively. This is a historic milestone that indicates the way people are consuming content is shifting. While the previous generations liked TVs and cables, Gen Z and Millennials prefer Netflix on WiFi. Lately, digital platforms are becoming a dominant form of entertainment.
In this blog, we’re taking a closer look at the video streaming landscape, from the numbers driving the industry to the way people actually watch content today. You’ll find clear insights on market size, user behavior, and the trends shaping what comes next. Let’s get into it.
Top Video Streaming Statistics
- The global video streaming market was valued at $674.25 billion in 2024 and is set to expand from $811.37 billion in 2025 to $2,660.88 billion by 2032, reflecting a CAGR of 18.5% during this period.
- The worldwide live streaming sector is forecasted to hit $345 billion by 2030, highlighting why live video is a powerful tool for brand engagement.
- Recent Nielsen research found that streaming services overtook both cable and broadcast TV, accounting for 44.8% of all TV usage compared to 24.1% for cable and 20.1% for broadcast in 2025.
- As of 2023, there were approximately 1.8 billion online video-on-demand (VOD) subscriptions globally, underlining the widespread adoption of streaming platforms.
- India’s TV viewer base is still larger (298 million) than the OTT user base of 110 million.
- People usually spend 6 hours on media and entertainment content daily.
- Audiences spent over 12 trillion minutes streaming in 2024, which is equal to 8.4 billion days.
Video Streaming Market Size
The global video streaming market was valued at $674.25 billion in 2024 and is projected to grow to $2,660.88 billion by 2032, with a CAGR of 18.5% from 2025 to 2032. North America dominated the market with a 38.36% share in 2024, with the U.S. video streaming market expected to reach $610.59 billion by 2032.
The content delivery services segment held the largest market share in 2024, driven by increased consumer spending on OTT platforms and live broadcasting. Asia Pacific is anticipated to register a remarkable CAGR during the forecast period due to the rising adoption of video-on-demand and OTT platforms.
| Year | Market Size (in billion USD) |
| 2024 | 674.25 |
| 2025 | 811.37 |
| 2026 | 946.80 |
| 2027 | 1121.96 |
| 2028 | 1329.52 |
| 2029 | 1575.48 |
| 2030 | 1866.94 |
| 2031 | 2212.33 |
| 2032 | 2621.61 |
Source: Fortune Business Insights
Revenue of the Video Streaming Industry
The video streaming industry grew from $58.5 billion in 2018 to $233 billion in 2024, representing a compound annual growth rate (CAGR) of approximately 25.9%. This impressive growth includes revenue from free video streaming apps like YouTube and TikTok alongside paid services. With the current growth rate, the video streaming industry revenue will reach $928.02 billion by the end of 2030. Along with this, the live streaming sector is predicted to reach $345 billion by 2030, highlighting why live video is a powerful tool for brand engagement.
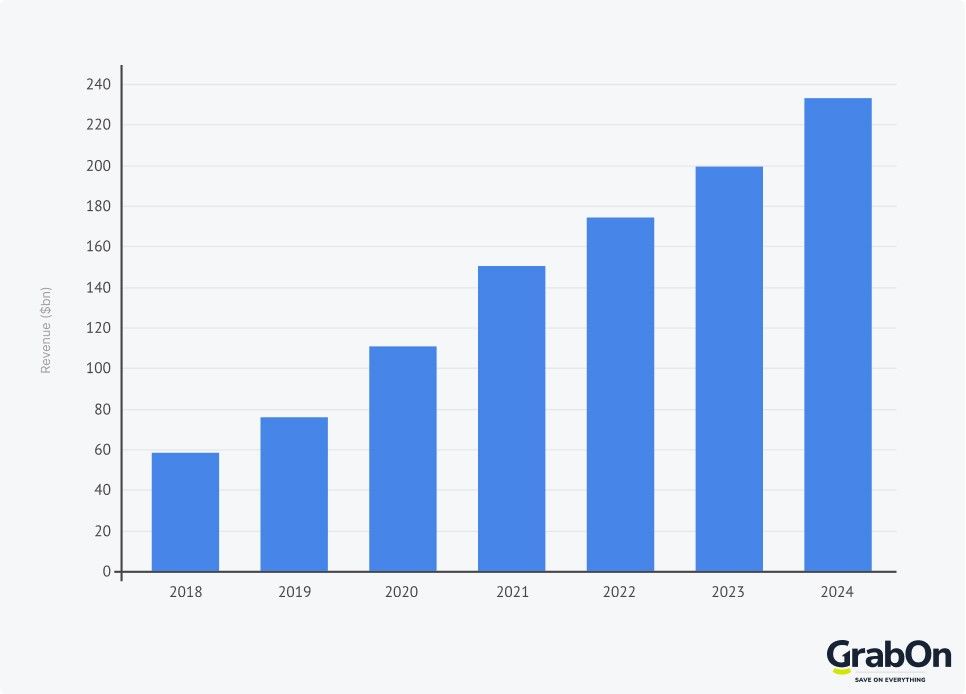
Source: Business of Apps, Teleprompter
Video Streaming Market Share
In May 2025, Streaming reached a historic milestone. It overtook both broadcast and cable viewing. Streaming accounted for 44.8% of total TV usage in the U.S., surpassing the combined share of broadcast (20.1%) and cable TV (24.1%) for the first time ever. Streaming usage has increased by 71% since May 2021, while broadcast and cable viewing have declined by 21% and 31% respectively. YouTube owns the majority of TV viewership; it alone captured 12.5% of TV viewership in May 2025, showing 120% growth since 2021.
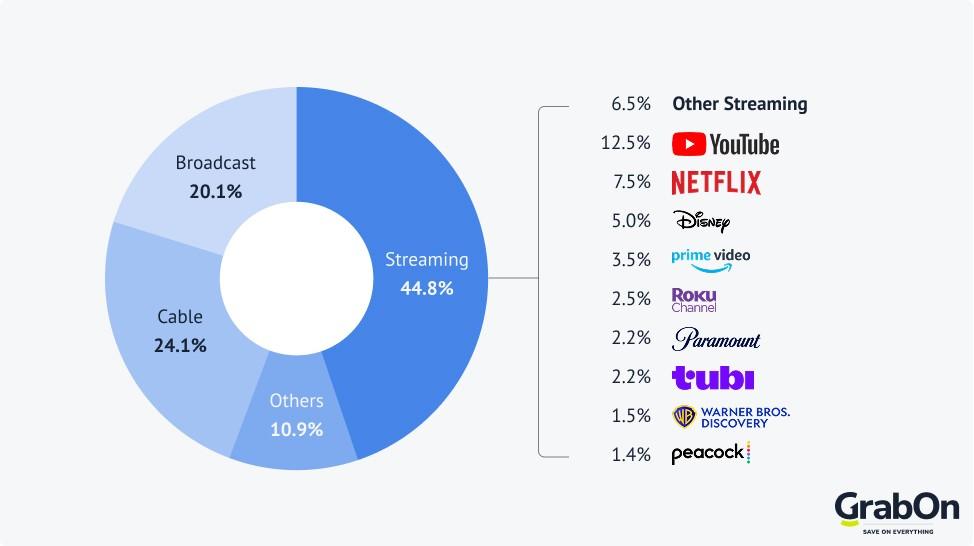
Source: Nielsen
Video Streaming Users in the USA
Forbes estimated in 2020 that there were 1.1 billion subscriptions to online video streaming services worldwide. As of 2025, the number could be closer to 1.8 billion. And the user penetration is around 17% in 2025, projected to reach 20.7% by 2027. The subscription growth has increased in the US from 52% in 2015 to 83% in 2023.
| Year | Proportion of Subscriptions (by Household in the US) |
| 2015 | 52% |
| 2017 | 64% |
| 2018 | 69% |
| 2019 | 74% |
| 2020 | 78% |
| 2021 | 78% |
| 2022 | 83% |
| 2023 | 83% |
Source: Exploding Topics
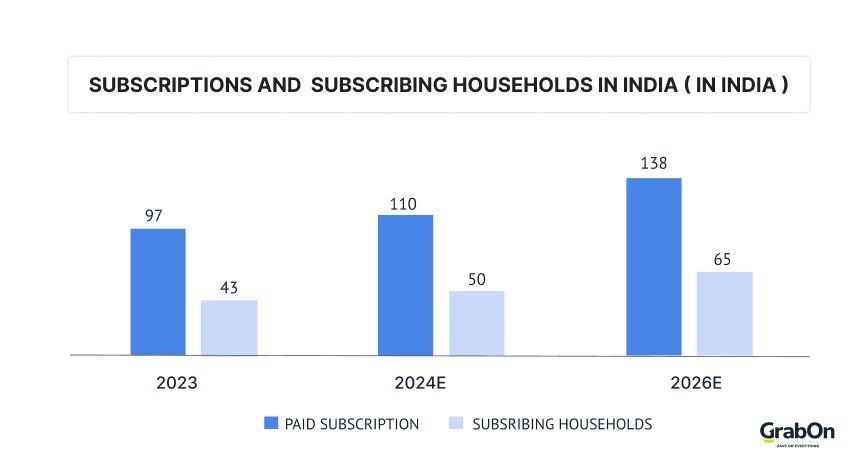
Video Streaming Users in India
While OTTs and subscription growth may be high in the USA, India tells a different story. In India, the TV viewer base is 298 million against the OTT user base of 110 million. There is also a significant overlap; 491 million Indians watch content on both television and OTT platforms, while 565 million don’t consume video content at all. This shows that India’s rural and semi-rural areas are still catching up to the digital platforms. TV and cables are still a large part of their form of content consumption.
But the number of households using OTT streaming services will increase from approximately 43 million in 2023 to around 65 million by 2026. On average, this reflects about 2 subscriptions per household, demonstrating a growing diversity of streaming options and subscription stacking trends among Indian consumers.
Time Spent Streaming: Usage Statistics
In 2024, audiences spent over 12 trillion minutes streaming, which is 23 million years’ worth of time. It is also a 10% increase over 2023, which was 11.1 trillion minutes. (almost 21 million years of streaming). Americans are now spending 43% of their time streaming (As of 2024), which is a steep increase compared to 26% in 2021.
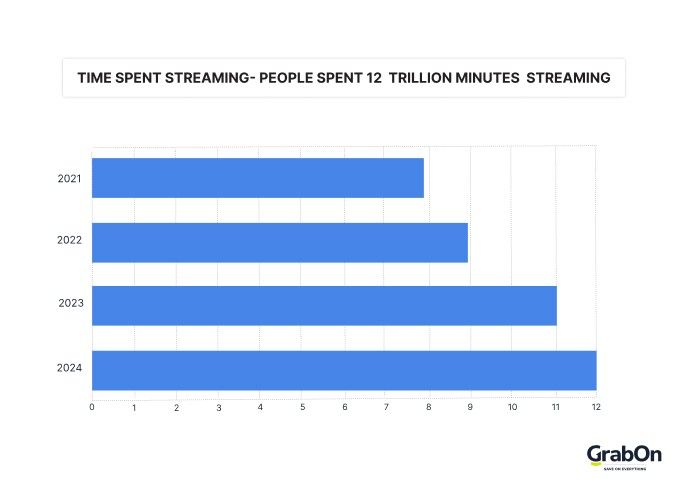
Source: Nielsen
Video Streaming User Behavior
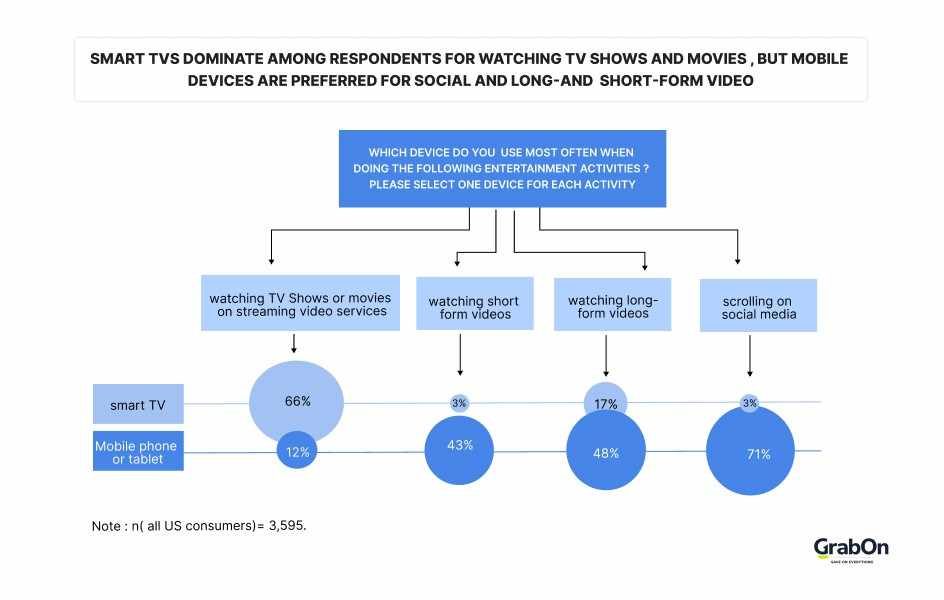
According to a study by Deloitte, on average, consumers spend 6 hours a day with media and entertainment content. Out of this, they dedicate about 1.4 hours to watching TV shows or movies on streaming video services. The table below shows that the usage varies by generation. Gen Z and Millennials spend more time streaming, while the older generations like Boomers and Matures spend more time on Cable/Live TV shows.
| Generation | Total daily hours | Streaming TV shows/movies (hrs) | Cable/Live TV shows/Movies (hrs) | Social media (hrs) | Listening to Music (hrs) | UGC videos (hrs) | Video Games (hrs) | Podcasts (hrs) |
| Gen Z | 6.9 | 1.3 | 0.8 | 1.4 | 1.0 | 1.0 | 1.1 | 0.3 |
| Millennials | 6.3 | 1.5 | 0.9 | 1.1 | 0.9 | 0.7 | 0.7 | 0.4 |
| Gen X | 6.0 | 1.6 | 1.3 | 0.9 | 0.8 | 0.5 | 0.5 | 0.3 |
| Boomers | 5.4 | 1.4 | 2.1 | 0.6 | 0.5 | 0.3 | 0.2 | 0.2 |
| Matures | 4.5 | 0.9 | 2.3 | 0.4 | 0.4 | 0 | 0.2 | 0.2 |
The streaming preference is also different, and based on the device choice. Smart TVs are the dominant choice (66%) for watching TV shows or movies via streaming video services, while mobile phones or tablets are preferred for short-form videos (43%), long-form videos (48%), and social media scrolling (71%). Only 12% use mobile phones/tablets for watching TV shows or movies on streaming services, highlighting smart TVs’ importance for premium content.
Source: Deloitte
Features that Video Streaming Users Find Important
As mentioned before, viewers spend at least 1.4 hours a day streaming. They have preferences that make them choose one streaming service over the other. For most people, cost (84%) plays a huge role when deciding which streaming platform to choose. Here are some other important things people take into consideration while subscribing to a streaming service.
| Video Streaming Feature | Percentage of people who think it is important |
| Cost | 84% |
| Ease of use | 81% |
| Variety/availability of content | 79% |
| Streaming/playback quality | 77% |
| Speed (menu selection, loading content) | 74% |
| Accessibility/search of desired content | 71% |
| Availability across devices | 58% |
| Resolution | 56% |
| Skipping ads feature | 52% |
| Ad-free | 48% |
| Content available for downloading/offline | 40% |
| Menu recommendations | 38% |
| Content available live | 37% |
Source: Exploding Topics
Streaming Services with the Most Subscribers
Netflix reigns supreme by being the platform with the most subscribers. As of 2023, Netflix had 260.28 million subscribers globally. It was closely followed by Amazon Prime Video, with 200 million subscribers. Here is a table showcasing the streaming services with the most subscribers.
| Streaming Platform | Users (in millions) | |
| 1 | Netflix | 260.28 |
| 2 | Amazon Prime Video | 200.0 |
| 3 | Disney+ | 150.2 |
| 4 | Max | 95.1 |
| 5 | Paramount+ | 63.4 |
| 6 | Hulu | 48.5 |
| 7 | Peacock | 28.0 |
| 8 | ESPN+ | 26.0 |
| 9 | AppleTV | 25.0 |
| 10 | Starz | 15.8 |
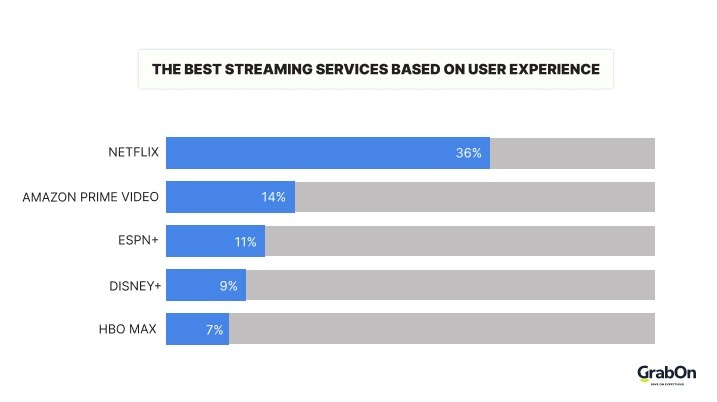
Netflix goes beyond numbers; it is not only the platform with the most subscribers, but it is also the streaming platform that people enjoy the most. It is followed by Amazon Prime Video, which is favored for its interface. Netflix’s success is not just because of its diverse content, but also because of providing an excellent user experience.
Source: Forbes
Top Online Streaming Platforms in India
JioHotstar (Disney+ Hotstar) leads the Indian streaming market with a 26% share, propelled by its extensive sports offerings and diverse content lineup. Amazon Prime Video holds the second position with 23%, followed by Netflix at 13%, both focusing on original series, movies, and varied content. Apple TV+ (14%) is also steadily growing in India’s crowded market. Regional platforms like ZEE5 (10%), JioCinema (7%), and Sony LIV (4%) maintain strong appeal with local TV shows and exclusive partnerships, catering to niche audiences within India’s competitive landscape.
| Streaming Platform | Market Share | Number of subscribers |
| JioHotstar | 26% | 38 million |
| Amazon Prime Video | 23% | 20 million |
| Netflix | 13% | 10 million |
| ZEE5 | 11% | NA |
| JioCinema | 7% | NA |
| Sony LIV | 4% | NA |
Source: Reuters
Netflix Statistics (Quick Glance)
As mentioned before, Netflix is the largest streaming player in the market with 301 million subscribers in over 190 countries. The highest number of Netflix subscriptions comes from the EMEA region, with 101.13 million subscribers in 2024. And the Millennials make up the most active viewer group on Netflix, with 41% of them tuning in at least once a month. Here is a look at the growth of Netflix over the years.
| Year | Paid Subscribers (in millions) |
| 2014 | 54.48 |
| 2015 | 70.84 |
| 2016 | 89.09 |
| 2017 | 110.64 |
| 2018 | 139.26 |
| 2019 | 167.09 |
| 2020 | 203.66 |
| 2021 | 221.84 |
| 2022 | 230.75 |
| 2023 | 260.28 |
| 2024 | 301.63 |
Source: Netflix Investor Relations, Statista, Statista (2)
Amazon Prime Video Statistics (Quick Glance)
Amazon Prime Video has more than 200 million monthly viewers (not subscribers). Some users may subscribe to Amazon Prime and not Prime Video, which is why the number may seem uneven. But according to a Business of Apps report, Prime Video has 230 million users as of 2024. As of Q3 2025, Prime Video has more market share (20%) than Netflix (19%) in the US Market. The table below showcases the growth of Prime Video users over the years.
| Year | Users (in millions) |
| 2019 | 90 |
| 2020 | 125 |
| 2021 | 155 |
| 2022 | 185 |
| 2023 | 210 |
| 2024 | 230 |
Source: Business of Apps
Disney Plus Statistics (Quick Glance)
Disney Plus was launched in 2019, but in just half a decade, it has become a $10 billion media conglomerate. At the end of Q4 2024, Disney+ had 122.7 million subscribers. The number has grown since then; as of Q3 2025, Disney+ has 127.8 million subscribers. Here is a look at the growth of Disney+ subscribers over the years:
| Year | No. of subscribers (in millions) |
| 2020 | 33.5 |
| 2021 | 68.4 |
| 2022 | 87.6 |
| 2023 | 104.9 |
| 2024 | 117.6 |
| Q3 2025 | 127.8 |
Source: Business of Apps
Top 10 Overall Streaming Programs (2024)
The most-streamed program in 2024 was Bluey on Disney+ with a massive 55.6 billion viewing minutes. It was particularly popular among children. Classics like Grey’s Anatomy and The Big Bang Theory continued their success across platforms. Here’s an overview of the top overall streaming programs:
| Program Name | Platform(s) | Total minutes viewed (billions) |
| Bluey | Disney+ | 55.62 |
| Grey’s Anatomy | Hulu/Netflix | 47.85 |
| Family Guy | Hulu | 42.44 |
| Bob’s Burgers | Hulu | 36.80 |
| NCIS | Hulu/Netflix/Paramount+ | 35.91 |
| Young Sheldon | Max/Netflix/Paramount+ | 32.08 |
| The Big Bang Theory | Max | 29.12 |
| Law & Order: SVU | Hulu/Peacock | 28.72 |
| Criminal Minds | Hulu/Paramount+ | 28.40 |
| Spongebob Squarepants | Paramount+ | 27.87 |
Source: Nielsen
Top 10 Streaming Originals (2024)
Netflix released Season 3 of Bridgerton between May and June, and garnered over 21 billion viewing minutes in 2024; the new episodes accounted for 56% of the total viewing. It was followed by Love Is Blind and the Boys. Here’s a table showing the performance of these shows:
| Program Name | Provider | Minutes viewed (in billions) |
| Bridgerton | Netflix | 21.42 |
| Love Is Blind | Netflix | 16.45 |
| The Boys | Prime Video | 13.58 |
| The Lincoln Lawyer | Netflix | 12.44 |
| Fallout | Prime Video | 11.95 |
| Futurama | Hulu | 11.75 |
| Fool me once | Netflix | 10.89 |
| Evil | Netflix/Paramount+ | 10.76 |
| Gabby’s Dollhouse | Netflix/Prime Video | 10.74 |
| Reacher | Prime Video | 10.57 |
Source: Nielsen
Top 10 Streaming Movies (2024)
In 2024, the top streaming movies were led by Disney+’s “Moana,” which amassed over 13 billion viewing minutes, making it the most-watched streaming movie for the second year in a row. Its high viewership peaked towards the year-end, coinciding with the theatrical release of its sequel, “Moana 2,” solidifying its position as the most-streamed movie since 2020. Following closely was Netflix’s “The Super Mario Bros. Movie,” which garnered about 11.7 billion minutes of viewing, with a significant portion of the audience comprising children aged 2-11.
Both “Moana” and “The Super Mario Bros. Movie” attracted strong Hispanic viewership, with 25% and 29.6% attributable to this demographic, respectively. The top 10 list was predominantly animated features, with Amazon Prime Video’s holiday action-comedy “Red One” standing out as the only live-action movie to make the cut, highlighting a particular dominance of family-friendly, animated films in streaming consumption for the year.
| Movie Name | Provider | Minutes viewed (in billions) |
| Moana | Disney+ | 13.03 |
| Super Mario Bros. Movie | Netflix | 11.72 |
| Trolls Band Together | Peacock/Netflix/Prime Video | 7.44 |
| Minions | Netflix | 6.77 |
| Encanto | Disney+ | 6.61 |
| Frozen | Disney+ | 6.28 |
| Paw Patrol: The Movie | Paramount+ | 6.05 |
| Inside Out | Disney+ | 5.78 |
| The Boss Baby | Netflix | 5.59 |
| Red One | Prime Video | 5.57 |
Source: Nielsen
Audience Subscription Fatigue
Before taking a subscription, people do have second thoughts; this feeling is called subscription fatigue. It is a reaction people have when taking a new subscription, with many believing they are spending too much money on streaming. Indians feel like they spend too much on streaming, while many streamers in Brazil state the opposite. Still 40% agree that they do not cancel their existing subscriptions to sign up for a new one. Here’s a look at the percentage of people and their feelings of subscription fatigue across countries:
| Country | % of respondents who feel like they spend too much on streaming | % of respondents who disagree with subscription fatigue |
| Germany | 36% | 38% |
| United Kingdom | 38% | 38% |
| Netherlands | 44% | 33% |
| Sweden | 47% | 25% |
| Spain | 39% | 36% |
| United States | 42% | 36% |
| Brazil | 40% | 41% |
| Australia | 44% | 29% |
| India | 53% | 23% |
| Japan | 32% | 32% |
| Singapore | 57% | 16% |
Source: Simon Kucher
Video Streaming Industry Trends
The global streaming market continues to grow at a similar pace as last year. There are signs of maturity and stabilization, with nuanced changes in consumption, subscription behavior, and competition from emerging platforms like social media. The following sections break down the core trends shaping the landscape.
Stabilization of market development in the video streaming industry
88% of the respondents continue to stream the same amount or more than the previous year. The proportion of people streaming about the same has increased by 3% in the past year, indicating the stabilization of growth in streaming consumption.
Source: Simon Kucher
Streaming growth in India and Brazil
The streaming market continues to grow, with India and Brazil benefiting from particularly strong growth. But the growth has plateaued in the mature markets like Europe (Germany, the United Kingdom, the Netherlands). Spain and Singapore are experiencing an increased share of users streaming about the same, which also indicates a stabilization of the video streaming industry in developed countries.
Source: Simon Kucher
The rise of content connoisseurs
There has been an increase in the awareness of what people are watching. The largest viewer segment is “content connoisseurs,” comprising 36%. These streamers always choose their content carefully according to their preferences. Binge watchers make up 30% of the streamers; they devour multiple episodes or movies in one sitting. Binge watching is especially prevalent in the USA, Sweden, and Brazil.
| Streamer Segment | Percentage |
| Content Connoisseur | 36% |
| Binge Watcher | 30% |
| Mainstream Watcher | 18% |
| Background Watcher | 8% |
| Social Watcher | 6% |
Source: Simon Kucher
Decline of traditional TV watching
Traditional TV is increasingly replaced by streaming, particularly in Spain, India, and Singapore, where over 70% see streaming as a substitute for linear TV. Although traditional streaming services are increasingly replacing traditional TV for individual streaming users, linear television continues to play a meaningful role at a societal level.
Source: Simon Kucher
Increased streaming subscriptions across countries
The average number of paid subscriptions per user rose from 2.8 in 2024 to 3.0 in 2025 globally. India leads with an average of 4.4 subscriptions. Streaming budgets grew by 20% on average, with countries like the United States, Brazil, and Japan seeing the steepest increases in monthly spending. While India may have the highest number of paid streaming subscriptions per respondent, it also has the lowest share of paid subscribers across all countries (34%), while the Netherlands has the highest share of paid subscribers (68%).
| Country | Percentage of Paid subscriptions | Percentage of free online services |
| Germany | 60% | 26% |
| United Kingdom | 55% | 30% |
| Netherlands | 68% | 17% |
| Sweden | 64% | 25% |
| Spain | 47% | 27% |
| United States | 52% | 30% |
| Brazil | 56% | 20% |
| Australia | 63% | 24% |
| India | 34% | 26% |
| Japan | 45% | 47% |
| Singapore | 45% | 34% |
Source: Simon Kucher
Social media preference over streaming
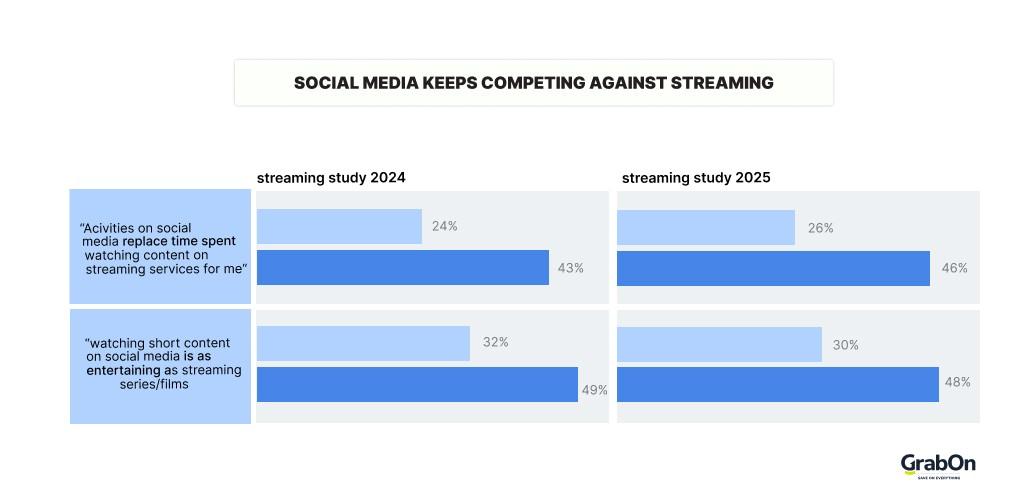
In 2025, over 46% people (18 to 39 years old) agreed that the activities on social media were replacing the time spent watching content on streaming services, which shows a rise from 43% in 2024. People are switching between streaming and social media. 48% of Gen Z and millennials agree that social media is as entertaining as streaming series.
Source: Simon Kucher
How streaming providers are retaining audiences
Providers are taking up various initiatives to retain viewers and increase subscribers. Some are providing more live streaming options while others are offering vouchers.
- Live streaming: A study into viewer behavior suggests that consumers spend 20% time live-streaming content like Sports (39%), concerts (39%), breaking news (35%), and gaming (20%).
- Ad-supported subscriptions: Many platforms offer lower-cost ad-supported subscriptions. Over 30% of Netflix and Disney+ subscribers are on ad tiers, which is nearly double that of 2024.
- Gaming add-on: Providers like Netflix are providing gaming integrations to increase retention. 41% of the users are open to gaming integration, though only a few are ready to pay a little extra for it.
- Retail vouchers: There has been an increase in purchases of retail vouchers for streaming services. India (90%) leads in retail voucher engagement for streaming services. That means if providers offer discounts or bundles, users are more likely to subscribe. In countries like India, the US, the UK, Spain, Brazil, and Japan, over half of the paid subscribers have at least one streaming service through a bundle.
| Country | % of respondents interested in retail vouchers for streaming services | % of respondents not interested in retail vouchers for streaming services |
| Germany | 69% | 25% |
| United Kingdom | 61% | 34% |
| Netherlands | 58% | 37% |
| Sweden | 59% | 36% |
| Spain | 69% | 28% |
| United States | 73% | 24% |
| Brazil | 67% | 31% |
| Australia | 64% | 31% |
| India | 90% | 85 |
| Japan | 57% | 32% |
| Singapore | 70% | 26% |
Source: Simon Kucher
Wrapping Up
The video streaming market is slowly stabilizing, with many countries reaching stable subscription habits. In the coming years, the video streaming habits of people are going to evolve. Many are going to subscribe to multiple platforms, and various platforms are going to add more restrictions on users. While video streaming is still going to be a major behavior of the young audience, the way providers customize their plans is going to affect viewership.