
The iPhone continues to dominate the smartphone market. With the iPhone 17 series launched in September 2025, Apple set new standards in innovation and design. As of 2026, the iPhone has over 1.56 billion active users worldwide.
From the first iPhone in 2007 to the iPhone 17, Apple has built one of the most successful product lines in tech history.
In this blog, we explore the latest iPhone user and sales statistics for 2026.
iPhone Statistics 2026 (Top Picks)
- Apple reported fiscal 2025 revenue of $416.16 billion, up 6.43% year-over-year.
- Around 28% of smartphone users worldwide use an iPhone.
- iPhones have 54% market share in the United States.
- In 2026, iPhone users worldwide are expected to reach 1.62 billion.
- Since 2007, Apple has sold over 2.7 billion iPhones globally.
How Many iPhones Are There?
Apple has released 54 iPhone models since 2007. This includes the SE, Pro, Plus, Air, and mini versions. The latest models are the iPhone 17 series and the ultra-thin iPhone Air, both launched in September 2025.
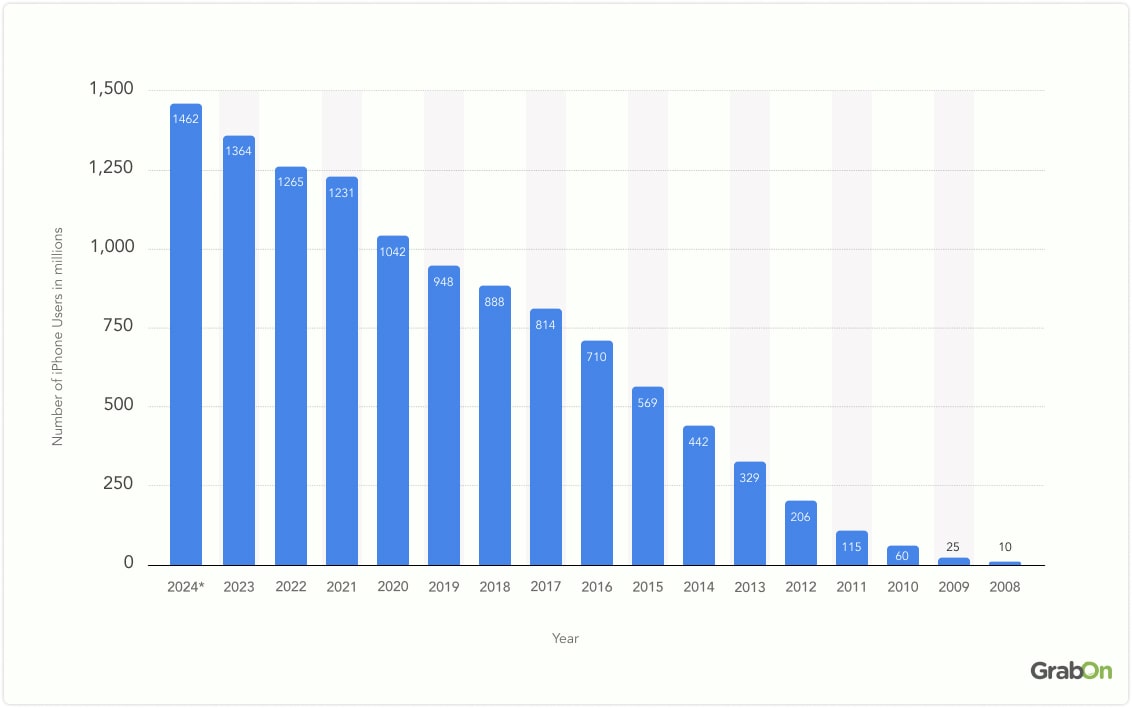
Number of iPhone Users Globally
There are 1.561 billion iPhone users worldwide as of early 2026. This represents almost 20% of the global population. Based on recent growth trends averaging 3.6% to 6.8% annually, GrabOn projects that this will reach approximately 1.62 billion by end of the year.
| Year | Number of iPhone Users |
| 2008 | 10 million |
| 2009 | 25 million |
| 2010 | 60 million |
| 2011 | 115 million |
| 2012 | 206 million |
| 2013 | 329 million |
| 2014 | 442 million |
| 2015 | 569 million |
| 2016 | 710 million |
| 2017 | 814 million |
| 2018 | 888 million |
| 2019 | 948 million |
| 2020 | 1,042 million |
| 2021 | 1,231 million |
| 2022 | 1,334 million |
| 2023 | 1,382 million |
| 2024 | 1,462 million |
| 2025 | 1,561 million |
| 2026 | 1,620 million |
-
- In the United States, iPhones account for 54% of all smartphone users. In Japan, that number is 68%.
- The U.S. is the iPhone’s largest market, accounting for about 20% of global iPhone users.
(Source: Backlinko, Statista)
Number of iPhone Users in India
As of 2026, over 14 million people use iPhones in India, representing 9% of the smartphone market. Additionally, Apple shipped 14 million iPhones in India in 2025, up from 10 million in 2024.
The iPhone 16 was the best-selling smartphone model in India for most of 2025, even though it costs more than twice the average phone price.
Apple now makes 20% of iPhones sold in India locally. This helps keep prices competitive. The company also sells older models like the iPhone 13 and iPhone 14 at lower prices, making iPhones more accessible.
iPhone Revenue Statistics
- Apple reported fiscal 2025 revenue of $416.16 billion, up 6.43% from 2024.
- Q2 2025 revenue was $95.4 billion, up 5% year-over-year.
- Q3 2025 revenue hit $94.0 billion, up 10% year-over-year. This was a record June quarter.
- iPhone accounts for about 50% of Apple’s total revenue. In fiscal 2024, iPhone sales brought in $201.1 billion out of $391.04 billion total.
Year Apple Revenue 2012 $156.5 billion 2013 $170.9 billion 2014 $182.8 billion 2015 $233.72 billion 2016 $215.64 billion 2017 $229.23 billion 2018 $265.6 billion 2019 $260.17 billion 2020 $274.52 billion 2021 $365.82 billion 2022 $394.33 billion 2023 $383.29 billion 2024 $391.04 billion 2025 $416.16 billion Apple’s revenue has grown over 2.5x in the past decade. Hardware remains the biggest revenue driver, but services like the App Store, iCloud, and Apple Music now make up over 22% of total revenue.
- Apple India revenue hit approximately ₹85,000 crore for fiscal year ending March 2025, driven by strong iPhone sales.
(Source: Statista, Apple, Bullfincher)
iPhone Market Share Globally
iPhones have about 28% market share among global smartphone users. That’s roughly 3 in every 10 smartphone users.
iPhone Market Share in the US
iOS has 58.81% market share in the United States, making it the dominant mobile OS.
| Year | iOS Market Share |
| 2024 | 58.81% |
| 2023 | 58.10% |
| 2022 | 56.74% |
| 2021 | 58.58% |
| 2020 | 59.54% |
| 2019 | 55.23% |
| 2018 | 54.82% |
| 2017 | 53.89% |
| 2016 | 53.19% |
| 2015 | 50.85% |
| 2014 | 52.30% |
| 2013 | 52.79% |
| 2012 | 49.48% |
| 2011 | 38.33% |
| 2010 | 38.31% |
| 2009 | 57.90% |
(Source: Counterpoint, StatCounter)
iPhone Market Share by Country
iPhones dominate in several developed countries. Japan leads with 68% iPhone users, followed by the USA at 59%, Canada at 60%, and Australia at 57%.
| Country | iPhone Market Share |
| USA | 59.31% |
| Japan | 68.75% |
| Canada | 60.38% |
| Australia | 56.88% |
| United Kingdom | 50.81% |
| India | 9% |
(Source: World Population Review, TechCrunch)
iPhone Shipment Volumes
In Q2 2025, Apple shipped 51.7 million units. Based on quarterly trends, we project full year 2025 shipments around 230-235 million units.
Apple shipped 225.7 million iPhones in 2024. This was slightly down from 231.8 million in 2023.
| Period | iPhone Shipments |
| Q2 2025 | 51.7 million |
| Q1 2025 | 54.7 million |
| 2024 Total | 225.7 million |
| 2023 Total | 231.8 million |
| 2022 Total | 225.3 million |
| 2021 Total | 233.9 million |
| 2020 Total | 206.1 million |
| 2019 Total | 191 million |
| 2018 Total | 208.8 million |
| 2017 Total | 213.3 million |
| 2016 Total | 215.4 million |
| 2015 Total | 231.5 million |
(Source: Backlinko, IDC)
Apple iOS Market Share
- iOS holds about 27.81% of the global mobile OS market. Android dominates with 71.56%.
- iOS has strong market share in wealthy countries but struggles in price-sensitive markets like India (4.88%) and China (22%).
(Source: StatCounter)
iPhone Sales by Year
- India’s smartphone exports hit $13.5 billion in H1 of fiscal 2026, with iPhone production making up a significant portion.
- Apple shipped 3 million iPhones in Q1 2025 in India, its largest ever for that period. The iPhone 16 series accounted for over half of these shipments.
- Over 2.7 billion iPhones have been sold worldwide since 2007.
| Year | iPhone Units Sold |
| 2024 (up to Q3) | 151.3 million |
| 2023 | 242 million |
| 2022 | 231.3 million |
| 2021 | 232.2 million |
| 2020 | 216.7 million |
| 2019 | 233.9 million |
| 2018 | 231.2 million |
| 2017 | 217.7 million |
| 2016 | 211.8 million |
| 2015 | 208.4 million |
| 2014 | 169.2 million |
| 2013 | 150.2 million |
| 2012 | 125 million |
| 2011 | 93.5 million |
| 2010 | 72.3 million |
| 2009 | 20.7 million |
| 2008 | 11.6 million |
| 2007 | 1.39 million |
- In Q4 2024, Apple shipped 80 million iPhones globally, driven by strong holiday demand for iPhone 15 and early iPhone 16 sales.
- The iPhone 17 launched in September 2025 with strong sales. Early data suggests it’s on track to match or exceed iPhone 16 performance.
(Source: Statista, Apple Insider, IDC)
iPhone Sales in India
Apple is expected to sell 4.5 to 5 million units of the iPhone 17 series in India during the festive season of 2025. Total iPhone shipments in India are projected to reach 15-16 million units in 2025, making Apple one of the top smartphone brands in the country.
In Q3 2025, Apple hit a record 5 million units shipped in India, securing 4th position in the market. The iPhone 16 was the most-shipped smartphone model, accounting for 5% of all phone shipments in India.
(Source: IDC, TechCrunch)
iPhone Sales by Model
The iPhone 17 launched in September 2025 and is showing strong early sales. Based on available data:
| Model | Units Sold/Highest Performance |
| iPhone 17 | 84 million (as of Oct 2025) |
| iPhone 16 | 100 million (2024) |
| iPhone 15 | 17 million (2023) |
| iPhone 15 Pro | 21 million (2023) |
| iPhone 14 Pro Max | 34 million (2022) |
| iPhone 14 & 14 Pro Series | 29 million (2022) |
| iPhone 13 series | 80 million (2021) |
| iPhone 12 series | 100 million (2020) |
| iPhone SE (2nd gen) | 24.2 million (2020) |
| iPhone 11 | 102 million (2019) |
| iPhone XR | 77.4 million (2018) |
| iPhone X | 63 million (2017) |
| iPhone 7/7 Plus | 159.9 million (2016) |
| iPhone 6/6 Plus | 222.4 million (2014) |
(Source: Business Insider, Counterpoint, Wikipedia)
Android Phone Vs. iPhone Market Share
- In India, Android holds 94.81% market share while iOS has 4.88% (as of March 2025).
- In the US, iOS leads with 57.36% and Android has 42.38%.
- Globally, Android holds 71.68% market share and iOS has 27.93%.
| Year | iOS (US) |
| 2024 | 58.81% |
| 2023 | 58.10% |
| 2022 | 56.74% |
| 2021 | 58.58% |
| 2020 | 59.54% |
| 2019 | 55.23% |
| 2018 | 54.82% |
| 2017 | 53.89% |
| 2016 | 53.19% |
(Source: Statista, StatCounter)
Interesting iPhone Facts
How many iPhones are sold in a day?
Based on 2024 data of 225.7 million units, Apple sold about 618,000 iPhones per day.
How many iPhones are sold per year?
In 2024, Apple shipped 225.7 million iPhones worldwide. In 2025, this number is projected to be around 230-235 million.
How many iPhones have been sold since 2007?
Over 2.7 billion iPhones have been sold worldwide since launch.
What percentage of Americans use iPhones?
As of 2024, 58.81% of smartphone users in the United States use an iPhone. This is nearly triple the global average of 28%.
When did iPhones come out?
The first iPhone was announced by Steve Jobs on January 9, 2007, and released on June 29, 2007.
What is the most recent iPhone?
The most recent iPhone as of 2026 is the iPhone 17 series, which launched in September 2025. This series includes the iPhone 17, iPhone 17 Pro, iPhone 17 Pro Max, and the new iPhone Air model.
How much was the original iPhone?
The original iPhone cost $499 for 4GB and $599 for 8GB. Today, it’s a collector’s item worth much more.
Why does Apple show 9:41 AM in ads?
The time 9:41 AM honors the moment Steve Jobs introduced the original iPhone.