
VPN (Virtual Private Network) technology was developed in the mid-1990s to help set up secure communication over the Internet. Microsoft introduced the Point-to-Point Tunneling Protocol (PPTP) in 1996, which is considered the first VPN protocol.
Today, VPN technology is used by over 1.6 billion users globally, representing nearly one-fifth of the global population. Indonesia has the highest VPN penetration among its population, with over 55% using a VPN service.
With the growing adoption of VPNs, the industry’s market value is steadily rising. As of 2025, it is around $71.66 billion and is projected to cross $154.09 billion by the end of 2029.
This statistical blog will provide you with in-depth insights into the VPN industry, including its demographics, market size, use cases, and challenges. It will also cover interesting data about cybercrimes and how different countries plan to fight against them, providing you with an overall idea about the latest scenario.
Key VPN Usage Statistics At a Glance
- As of 2025, over 1.6 billion people use VPNs globally, thats about 28.7% of all internet users.
- The VPN industry is valued at around $71.66 billion worldwide.
- Over two-fifths of the VPN service users are males, and 38% are females.
- Indonesia and India lead in VPN use, with 55% and 43% penetration rates, respectively.
- The United States is the top target for cybercrimes, with over 140 entities affected.
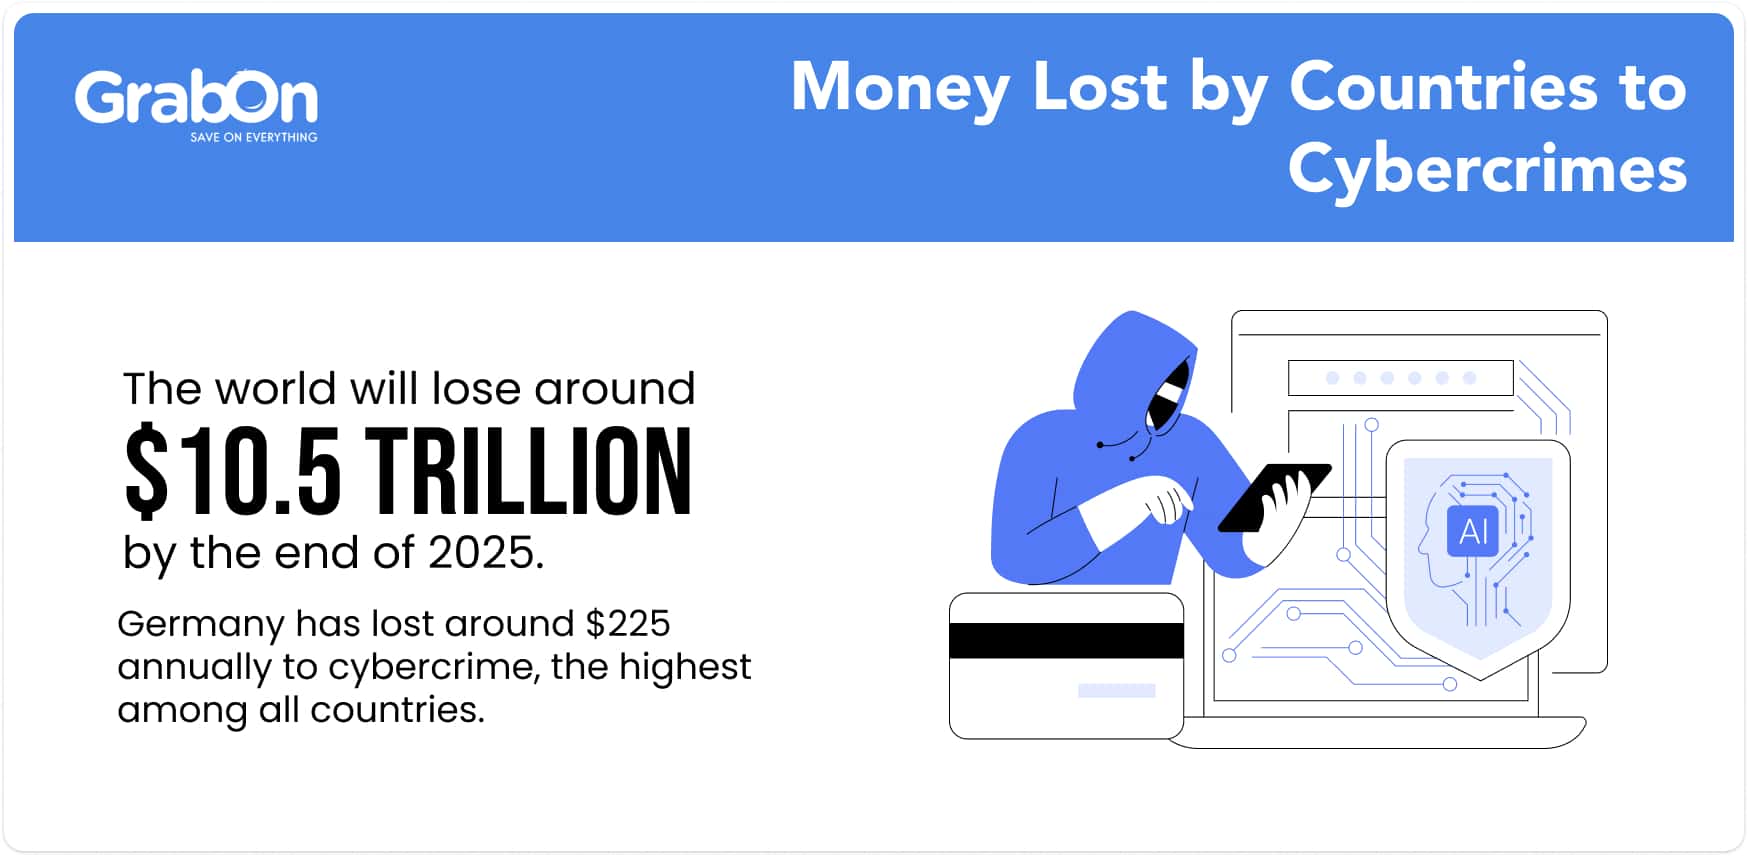
- By the end of 2025, countries are projected to lose around $10.5 trillion to cybercrimes.
Number of VPN Users Globally
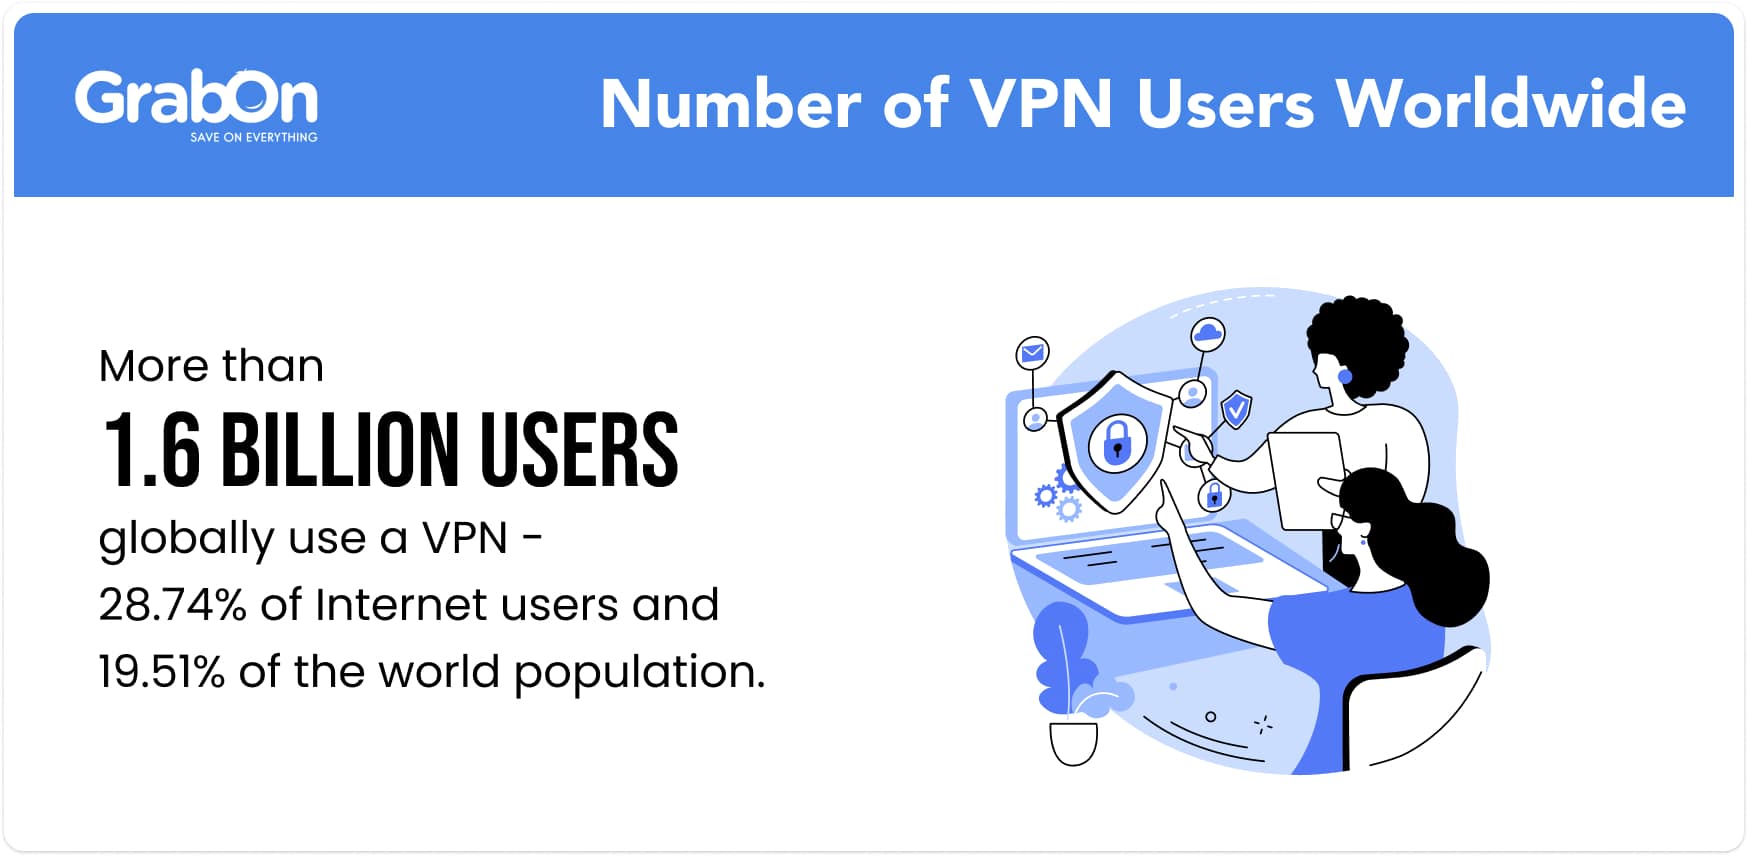
As of 2025, over 1.6 billion people worldwide use a VPN, a 6.67% increase from 1.5 billion in the last year. This is around 28.74% of the total Internet users and 19.51% of the world’s population.
This number is expected to increase gradually and cross 2 billion by the end of 2028.
Among the 1.6 billion VPN users worldwide, 51.4% use only free VPN services. Meanwhile, 34.6% prefer only paid VPNs, and 14% use a combination of both free and paid options.
The table below shows the detailed breakdown of the distribution of VPN users by cost:
| Types of VPN Users | Share of VPN Users |
| Use only free VPNs | 51.4% |
| Use only paid VPNs | 34.6% |
| Use free and paid VPNs, combinedly | 14% |
Source: Surfshark
VPN Users by Country
Indonesia dominates the list of VPN usage by country, with around 55% of its population using VPN services.
India ranks second with 43%, while the United Arab Emirates ranks third, with 38% of its population using VPNs.
Here is the complete breakdown of the VPN usage by countries:
| Country | Percentage of its population using VPNs | Number of VPN Users |
| Indonesia | 55% | 157 million |
| India | 43% | 628 million |
| UAE | 38% | 4.3 million |
| Thailand | 38% | 27.2 million |
| Malaysia | 38% | 13.7 million |
| Saudi Arabia | 37% | 12.7 million |
| Philippines | 37% | 43.2 million |
| Turkey | 36% | 31.5 million |
| South Africa | 36% | 23.3 million |
| Singapore | 33% | 1.9 million |
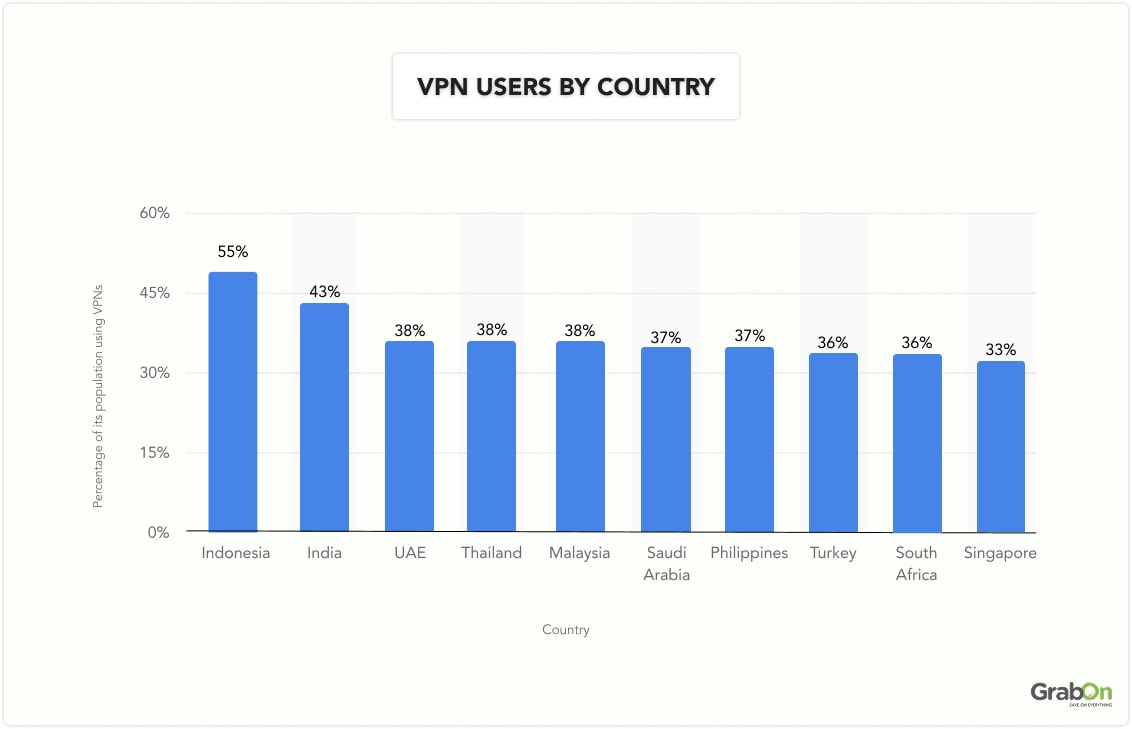
This data shows that around six Asian countries are in the top 10 list, making it the largest market for VPN service providers.
Source: Global Web Index
VPN Users by Gender
Around 54% of VPN users worldwide are males, while 46% are females. The gender gap in VPN users is relatively small, and it is projected that it will be on par by the end of this decade.
Compared to reports published in 2018, around 62% of VPN users at that time were male, and only 38% were female.
The number of female VPN users has grown significantly, surpassing the growth rate of male users.
| Year | Male Users | Female Users |
| 2025 | 54% | 46% |
| 2018 | 62% | 38% |
Source: Global Web Index, Surfshark
VPN Users by Age Group
Around 22.8% of VPN users are in the 25 to 34-year age group. It is followed by the 45 to 54 age group, with about 17.4% of users using VPNs.
Users from 16 to 24 years rank third, with around 16.5% using VPN services.
Here is the complete breakdown of VPN users by different age groups:
| Age Group | Share of Users Using VPNs |
| 16 to 24 years | 16.5% |
| 25 to 34 years | 22.8% |
| 35 to 44 years | 15.5% |
| 45 to 54 years | 17.4% |
| 55 to 64 years | 12.9% |
| 65+ years | 14.8% |

Source: Surfshark
VPN Usage Statistics
In recent years, VPN usage has surged as more online users consider it essential due to the rising threat of cybercrime. Besides security, watching geo-restricted movies and TV series is another reason why a majority of people use a VPN worldwide. Here are various VPN usage statistics that might intrigue you:
VPN Usage by Devices
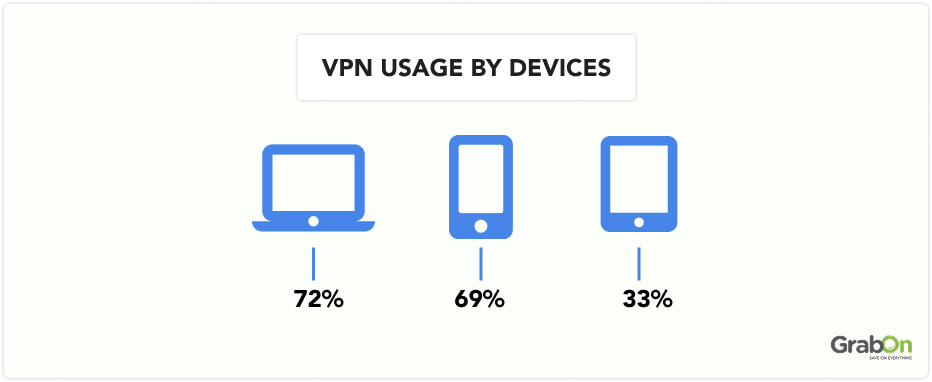
72% of users use VPN services on PCs on average once a month. Whereas, 69% of the users use the services on smartphones, and one-third use them on tablets.
Around 52% of smartphone users use VPN services on iOS devices, while only 37% use them on Android.
The table below shows VPN usage by devices:
| VPN Usage by Devices | ||
| PC | Smartphone | Tablet |
| 72% | 69% | 33% |
Source: Global Web Index
VPN Usage by Use Cases
About 39.4% of users globally use VPN services for work purposes, while 25.4% use them for security reasons.
24.4% of global users use VPNs for playing games. Whereas around only 5.7% use them while travelling.
Here is the detailed breakdown of VPN usage by different use cases:
| Use Case | Share of VPN Users |
| Work | 39.4% |
| Security | 25.4% |
| Gaming | 24.4% |
| Travel | 5.7% |
| Privacy | 5.1% |
Source: Surfshark
VPN Usage by Frequency
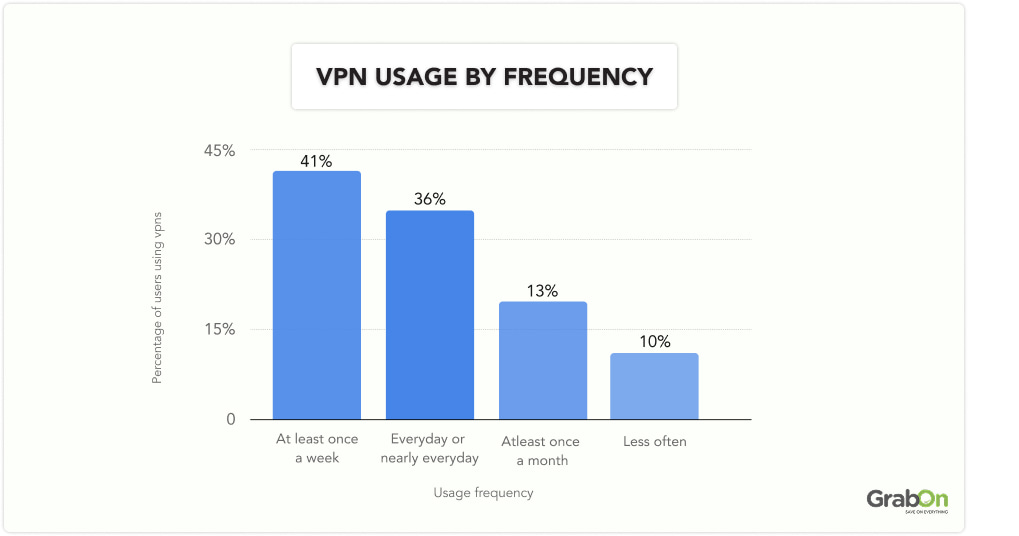
Around 41% of global users use VPNs at least once a week, while roughly 36% use them every day or nearly every day.
Only 13% of users use VPN services at least once a month, while 10% use them less frequently.
The table below shows how often people use VPNs:
| Usage Frequency | Percentage of Users Using VPNs |
| At least once a week | 41% |
| Every day or nearly every day | 36% |
| At least once a month | 13% |
| Less often | 10% |
Source: Surfshark
Motivations to Use a VPN
Over half of the users use VPNs to access entertainment, while around 31% use them to access social media or news networks, and for browsing privacy reasons.
Another 30% of users use them to access work files or services and access restricted torrents. Around 27% of them use to communicate with friends and family abroad.
Here is the table to showcase the top motivations to use a VPN:
| Top Motivations | Share of Users Using a VPN |
| Access entertainment content | 51% |
| Access social networks | 34% |
| Browsing privacy | 34% |
| Access sites/files/services at work | 30% |
| Access restricted torrents | 30% |
| Communicate with friends and family abroad | 27% |
| Hide web browsing from the government | 20% |
| Access a Tor Browser | 19% |
Source: Global Web Index
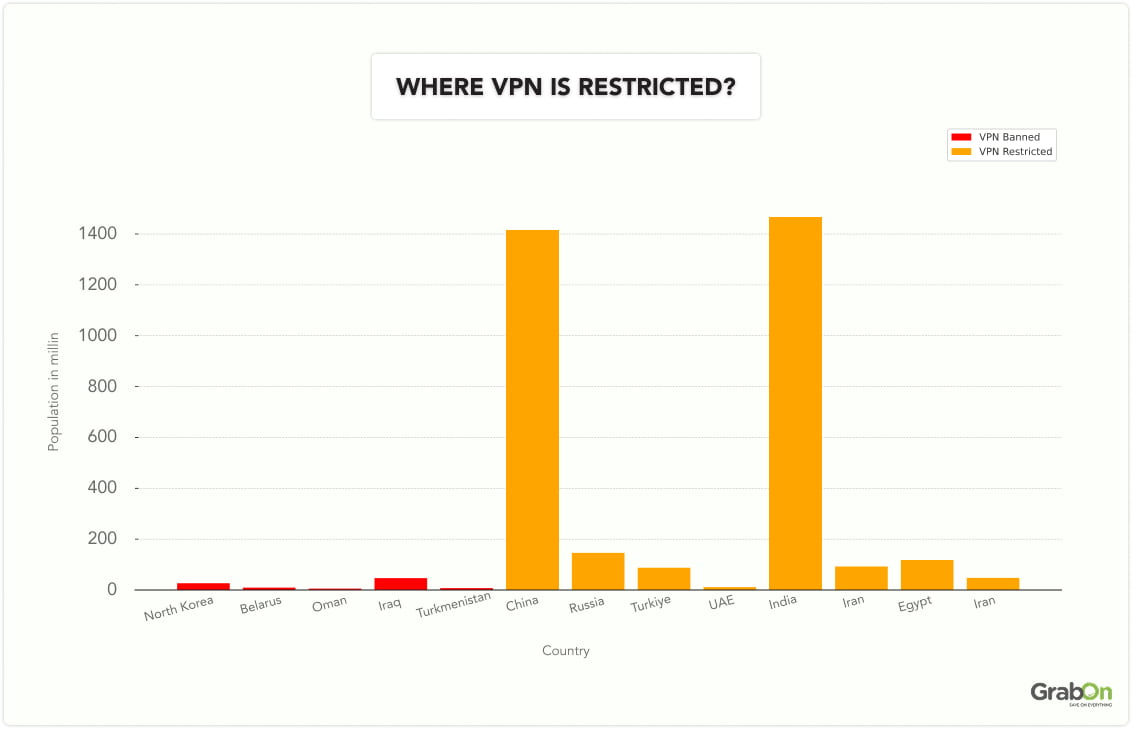
Where VPN is Restricted?
VPN services are banned or restricted in countries where around 43% of the global population lives.
Some countries, including North Korea, Belarus, Oman, Iraq, and Turkmenistan, have completely banned VPNs. And, it is restricted in China, India, Russia, and Iran.
Here is the list of countries where VPNs are banned or restricted:
| Country | Population (2025) | VPN Status |
| North Korea | 26.5 million | Banned |
| Belarus | 9.2 million | Banned |
| Oman | 5.49 million | Banned |
| Iraq | 46.5 million | Banned |
| Turkmenistan | 7.6 million | Banned |
| China | 1.416 billion | Restricted |
| Russia | 146 million | Restricted |
| Türkiye | 87.6 million | Restricted |
| UAE | 11.3 million | Restricted |
| India | 1.464 billion | Restricted |
| Iran | 92.4 million | Restricted |
| Egypt | 117.9 million | Restricted |
| Uganda | 47.5 million | Restricted |
Source: NordVPN
Reasons People Don’t Use a VPN
Around 59% of VPN users don’t use them as they don’t need one, while 22% think VPN services are expensive.
About 21% of users avoid VPNs because they find the setup process too complicated. In contrast, only 1% say slow internet speeds are the reason they don’t use a VPN.
Here is the complete breakdown of the top reasons why people don’t use a VPN:
| Reasons | Share of Users Not Using A VPN |
| Don’t need one | 59% |
| Too expensive | 22% |
| Too much trouble to set up | 21% |
| Unsure of the benefits | 20% |
| Don’t trust that they’re secure | 7% |
| Can’t access the sites I’d like to | 3% |
| Speed issues | 1% |
Source: Surfshark
VPN Industry Market Value
As of 2025, the market value of the VPN industry is around $71.66 billion, a 16.7% increase from $61.42 billion in 2024.
The VPN market is projected to grow at a CAGR of 21.1%, reaching around $86.76 billion by 2026, $105.10 billion by 2027, and finally reaching $154.09 billion by 2029.
The table below shows the year-on-year breakdown of the VPN industry market value:
| Year | Year-on-Year VPN Industry Market Value |
| 2029* | $154.09 billion* |
| 2028* | $127.27 billion* |
| 2027* | $105.10 billion* |
| 2026* | $86.76 billion* |
| 2025 | $71.66 billion |
| 2024 | $61.42 billion |

Source: The Business Research Company
Best VPN Service Providers Globally
As of 2025, NordVPN is considered the best VPN service provider, scoring 9.7 out of 10 in privacy. Surfshark ranks second with a score of 9.5 in security.
Private Internet Access ranks third in the Windows segment with a test score of 9.4, and Hotspot Shield scored 8.9 out of 10.
Here is the list of the best VPN service providers worldwide by test score in different categories:
| VPN Service Provider | Test Score out of 10 | Best For |
| NordVPN | 9.7 | Privacy |
| Surfshark | 9.5 | Security |
| Private Internet Access | 9.4 | Windows |
| Hotspot Shield | 8.9 | Netflix |
| Norton Secure VPN | 8.4 | Dynamic IP Addresses |
| IPVanish | 9.3 | Customer Support |
| ExpressVPN | 9.1 | Encryption |
| CyberGhost VPN | 8.9 | Mac |
| ProtonVPN | 8.8 | Work |
| UltraVPN | 9.2 | Day-to-Day Use |
Source: Security.org
Top VPN Service Providers by Download Speed
NordVPN is the fastest VPN service provider worldwide, with a download speed loss of 5.78%. Surfshark ranks second with a download speed loss of 7.76%. These service providers have upload speed losses of 4.11% and 49.98%, respectively.
Private Internet Access ranks fourth in the list with a download speed loss of 4.84% and an upload speed loss of 84.26%.
| VPN | Upload Speed Loss | Upload Speed Loss |
| NordVPN | 5.78% | 4.11% |
| Surfshark | 7.76% | 49.98% |
| Private Internet Access | 4.84% | 84.26% |
| IPVanish | 4% | 5.02% |
| ProtonVPN | 8.18% | 4.08% |
Source: Security.org
Top VPN Service Providers by Number of Servers
As of 2025, Private Internet Access tops the list for having the highest number of servers worldwide, with over 35,000 servers distributed across 91 countries.
CyberGhost and NordVPN rank second and third with over 11,500 and 6,200 servers globally, respectively.
| VPN | Number of Servers | Number of Countries |
| Private Internet Access | 35,000 | 91 |
| CyberGhost | 11,500 | 100 |
| NordVPN | 6,200 | 111 |
| ExpressVPN | 3,000 | 105 |
Source: VPN.com
Number of Cyberattacks in The World
140 entities were targeted in the United States in 2024, making it the most targeted nation worldwide. The country accounted for around 50.2% of global ransomware cases, totaling 2,713 incidents.
India ranks second, with around 95 entities experiencing data theft. There were 108 reported known cases, with different groups, such as Lockbit, Killsec, and Ransomhub. The country leads the list in the mobile malware category, accounting for around 28% of such attacks. Nearly 350 million attacks were faced in the healthcare and hospitality sectors.
Israel experienced data breaches affecting around 57 entities, and Canada experienced around 283 ransomware cases last year.
Source: The Tribune, Cyberint, The Times of India, GoodReturns, Business Today, The Economic Times
Loss of Money to Cybercrimes by Countries
The worldwide cybercrime costs are projected to cross $10.5 trillion annually by the end of 2025.
Germany lost over $225 billion yearly to cybercrime, ranking first globally. While France ranks second, losing over $67 billion.
The United Kingdom and Indonesia rank third and fourth, with both losing over $34 billion to cybercrimes.
Here is the table to showcase how much money countries lose annually to cybercrime:
| Country | Money Lost to Cybercrime Annually |
| Germany | $225 billion |
| France | $67 billion |
| United Kingdom | $34 billion |
| Indonesia | $34 billion |
| Brazil | $22.5 billion |
| Australia | $22 billion |
| United States | $10 billion |
| Mexico | $3 billion |
| Japan | $2.5 billion |
| Norway | $1.9 billion |
| United Arab Emirates | $746 million |
| Canada | $530 million |
| Singapore | $475 million |
| Nigeria | $210 million |
Source: ExpressVPN, Cobalt