
Launched in 2014, the ‘Make In India’ initiative has played an important role in India’s revolutionary growth.
Over a decade has passed, and the results of this movement are obvious. Let us look at the measurable impact that the Make In India scheme has had over the last ten years and what is latest as of 2026.
Make In India Statistics Top Picks
- India now manufactures 99% of its smartphones domestically.
- India’s ranking in the World Bank’s Doing Business Report improved from 142nd in 2014 to 63rd.
- Due to Make in India, renewable energy capacity in India has grown by 400% between 2014 and 2024.
- India’s toy industry now produces 400 million toys each year, reducing imports and boosting local manufacturing.
- The PLI scheme has attracted investments of INR 2.16 lakh crore, achieved INR 20.41 lakh crore in cumulative production, INR 8.3 lakh crore in exports, and generated over 14.39 lakh jobs across 14 sectors.
Make In India Statistics: Manufacturing Sector
With India becoming a strong manufacturing hub in various industries, the Make In India initiative has had a significant impact on India’s manufacturing sector.
- India’s renewable energy capacity has increased by 400% in the past decade, making it the 4th largest producer of renewable energy in the world. (Business Today)
- Thanks to the Make In India movement, the country produces 400 million toys every year. (VisionIAS)
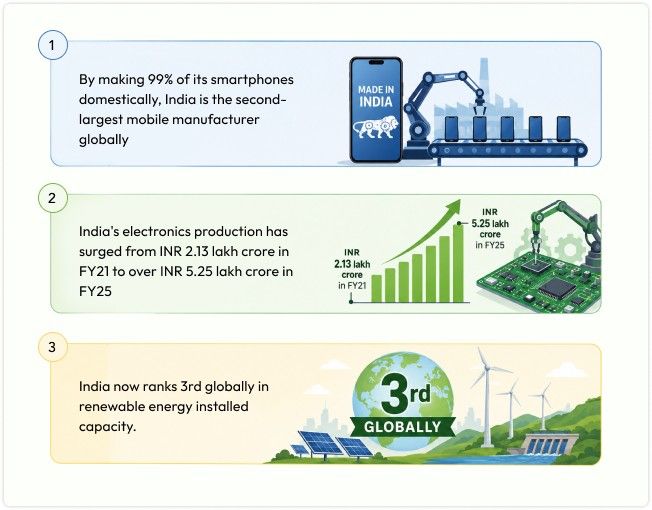
- By making 99% of its smartphones domestically, India is the second-largest mobile manufacturer globally. (VisionIAS)
- Domestic mobile phone production increased from 58 million units in 2014-15 to 330 million units in 2023-24, with exports exceeding 50 million and imports dropping considerably. (Investing)
- India’s defense production reached a record high of INR 1.27 lakh crore in 2023-24, with exports to over 90 countries. (IBT)
- Apple’s iPhone exports from India crossed $23 billion in calendar year 2025, an 85% jump YoY. In the first nine months of FY 2025-26, iPhone shipments totalled nearly $16 billion. India now accounts for roughly 25% of global iPhone production, up from around 6% in 2023. Smartphones became India’s single largest export category in FY 2024-25, with total smartphone exports reaching $30.13 billion. (Outlook Business)
- Maruti Suzuki announced an investment of around $864 million (INR 74.1 billion) to build a third plant at its Kharkhoda factory in Haryana, expanding production capacity to 750,000 vehicles per year by 2029. (Reuters)
- Manufacturing jobs have grown by 200% between 2022 and 2024. (ETManufacturing)
- India’s electronics production has surged from INR 2.13 lakh crore in FY21 to over INR 5.25 lakh crore in FY25, a nearly 2.5x jump driven by PLI support. (Reuters)
- India’s Semicon India Programme has attracted investment commitments of approximately INR 1.6 lakh crore. One unit (Micron, Sanand) has commenced commercial production with 500,000+ sq ft of cleanroom space, and three facilities are running pilot production lines. Micron expects to assemble tens of millions of chips in 2026, scaling to hundreds of millions in 2027. (India Briefing / MeitY, March 2026)
- Since the launch of Make In India, India has become the world’s second-largest producer of textiles and garments, accounting for 4.6% of global trade. (SiliconIndia)
- In 2024, textile exports grew by 11.56%, and apparel exports registered a 35% year-on-year growth. (SiliconIndia)
- India now ranks 3rd globally in renewable energy installed capacity. Total non-fossil fuel capacity reached 283.46 GW as of March 2026, with renewable energy capacity at 274.68 GW, a 3.59x increase from 76.38 GW in 2014. Solar capacity alone surged 53x from 2.82 GW to 150.26 GW. FY 2025-26 saw a record 55.3 GW of non-fossil capacity addition, nearly double the previous year’s 29.5 GW. (PIB / MNRE, April 2026)
- India’s manufacturing PMI surged to 55.9 in April 2026, indicating strengthening business conditions. IIP growth for FY 2025-26 remained resilient, with February 2026 recording 5.2% and March 2026 at 4.1% growth. Capital goods led with 14.6% expansion. (HSBC / MoSPI)
Make In India Statistics About Business & Policy Reforms
The Make In India initiative introduced several beneficial policies and regulations for businesses. These policies have promoted the ease of doing business and have helped small and big businesses alike.
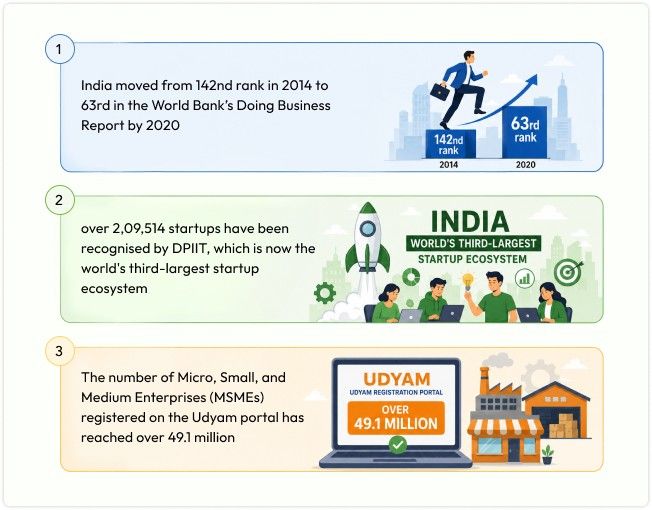
- India moved from 142nd rank in 2014 to 63rd in the World Bank’s Doing Business Report by 2020. (VisionIAS)
- Since the launch of MII, over 40,000 compliances have been reduced, and 3,800 legal provisions have been decriminalized. (VisionIAS)
- The National Single Window System has approved over 75,000 applications, making investment processes easier in India. (VisionIAS)
- Gross FDI inflows rose to $64.7 billion in April-November 2025 (first 8 months of FY26), up from $55.8 billion in the same period of FY25, an 18% increase. Cumulative FDI inflows from April 2000 to September 2025 reached $1.12 trillion. India ranked 4th globally in Greenfield investment announcements in 2024. (Economic Survey 2025-26 / DPIIT)
- FDI in the electronics sector rose by 254% since the launch of Make in India. (SiliconIndia)
- Between 2014 and 2024, India received a total of $667.4 billion in FDI, a 119% increase over the previous decade. (Business Today)
- As of January 2026, over 2,09,514 startups have been recognised by DPIIT, the world’s third-largest startup ecosystem. Nearly 44,000 startups were registered in 2025 alone, the highest in any single year. These startups have collectively created over 2.1 million direct jobs. India now has approximately 125 unicorns, up from just 4 in 2014, with combined valuation exceeding $350 billion. (PM Modi, National Startup Day, Jan 2026)
- The number of Micro, Small, and Medium Enterprises (MSMEs) registered on the Udyam portal has reached over 49.1 million, including 18.5 million women-owned enterprises. These MSMEs have collectively generated employment for approximately 211.7 million individuals and contributed 30.1% to India’s GDP in the fiscal year 2022-23. (The Financial Express)
- As of August 2024, the Production Linked Incentive scheme (PLI) has received investments worth INR 146,000 crore, resulting in a production output of INR 12.5 lakh crore. This strategy has increased exports by INR 4 lakh crore and created 900,000 jobs. (The Business Today)
- India’s EV market was valued at approximately $3.7 to $5.3 billion in 2025. EV sales grew 16.9% in FY25 to 1.97 million units. Electric passenger car registrations surged 83.63% YoY to 199,923 units in FY 2025-26. The e-3W target of 2.88 lakh units under PM E-DRIVE was achieved ahead of schedule. (IBEF / MarqStats, 2026)
- Under the PM GatiShakti initiative (a part of the Make In India scheme), over 208 large-scale infrastructure projects worth over $180 billion were assessed by 2024, addressing critical infrastructure gaps in sectors like coal, steel, fertilizers, and food distribution. (SiliconIndia)
Make in India Statistics: Railway Sector
The Make In India scheme has remarkably impacted the Indian Railways, promoting domestic manufacturing and reducing imports.
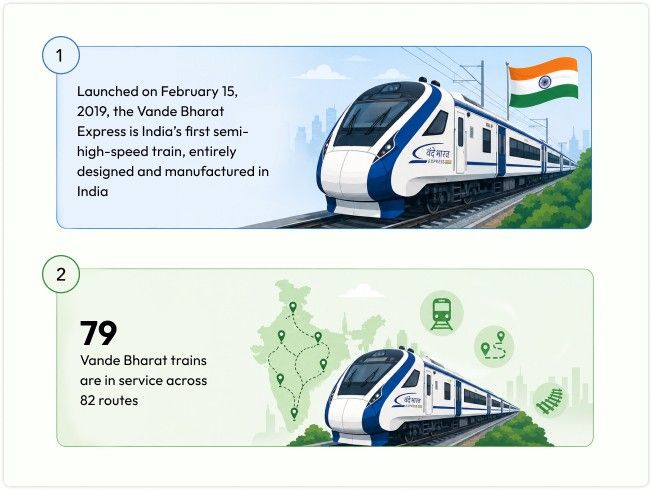
- Launched on February 15, 2019, the Vande Bharat Express is India’s first semi-high-speed train, entirely designed and manufactured in India. (News18)
- 90% of Delhi Metro’s trains are made domestically under the ‘Make in India’ program, demonstrating India’s growing capacity to produce modern metro coaches. (Economic Times)
- With providing locally made coaches, locomotives, and components to 16 countries, including the UK, Saudi Arabia, and France, India has emerged as a key player in the global railway export market. (ETNow)
- Between 2014-15 and 2021-22, Indian Railways increased its coach production from 3,731 to 7,151 units, a growth of 91.6%. (ThePrint)
- As of April 2026, 79 Vande Bharat trains are in service across 82 routes (162 services), including 21 twenty-car, 17 sixteen-car, and 41 eight-car formations. The first Vande Bharat Sleeper Express (Howrah-Kamakhya) was inaugurated on January 17, 2026, with a 16-coach, 823-berth configuration. Indian Railways is now manufacturing approximately 7,000 new coaches per year. (Ministry of Railways)
Make In India Statistics: India’s Export Scene
The ‘Make in India’ initiative has greatly influenced India’s export landscape across various sectors. Here are some key statistics highlighting its impact:
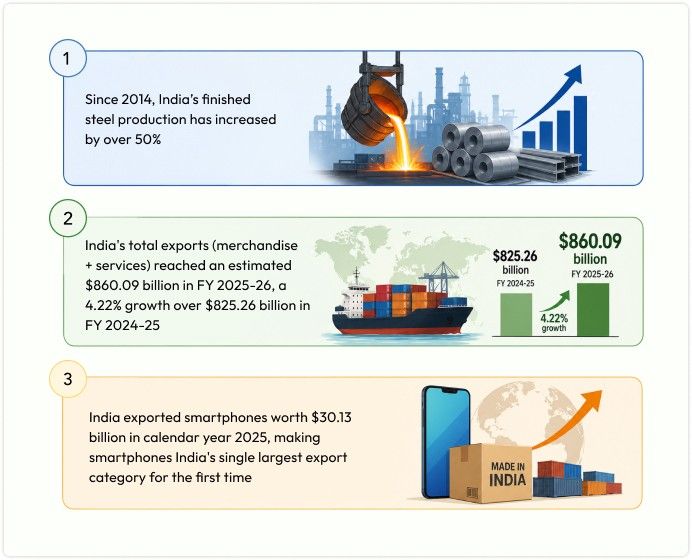
- Since 2014, India’s finished steel production has increased by over 50%, enabling the country to become a net exporter of finished steel. (ThePrint)
- India’s Defense production exports grew from INR 1,000 crore in 2014 to INR 21,000 crore in 2024, expanding to over 85 countries. (ThePrint)
- The PLI scheme which was introduced to improve domestic manufacturing, attracted investments of INR 1.46 lakh crore, leading to a manufacturing output of INR 12 lakh crore and increasing exports by INR 4 lakh crore. (BusinessToday)
- India’s total exports (merchandise + services) reached an estimated $860.09 billion in FY 2025-26, a 4.22% growth over $825.26 billion in FY 2024-25. Merchandise exports stood at $441.78 billion, while services exports reached $418.31 billion (up 7.94% YoY). (PIB, April 2026)
- India exported smartphones worth $30.13 billion in calendar year 2025, making smartphones India’s single largest export category for the first time, up from 167th rank in 2015. Mobile phone exports grew 127-fold from INR 1,500 crore in FY15 to INR 2 lakh crore in FY25. (Outlook Business / Business Standard, Jan 2026)
Make In India Statistics: Innovation & Research Growth
- The Indian government has invested over $1.2 billion in the AI sector to boost computing power, support local startups, expand AI education, and develop advanced AI models. (Time)
- In September 2024, NXP Semiconductors announced a commitment to invest over $1 billion in its R&D efforts in India. This initiative is designed to double the company’s current activities and strengthen India’s role in semiconductor design and innovation. (Reuters)
- India’s solar photovoltaic (PV) module manufacturing capacity has jumped from 2.3 GW in 2014 to 67 GW in 2024. This rapid growth enables India to meet its domestic needs and serve international markets, establishing the country as a leader in renewable energy manufacturing. (Energy Asia)
- In December 2024, India’s effort to build its own Earth observation satellites attracted 30 companies. This project aims to reduce the need for foreign data for important uses such as defense and managing infrastructure. (Reuters)
Make In India Statistics About Women Empowerment
The Make in India initiative has contributed to various developments in the Indian economy, including aspects related to women’s employment. Here are some relevant statistics:
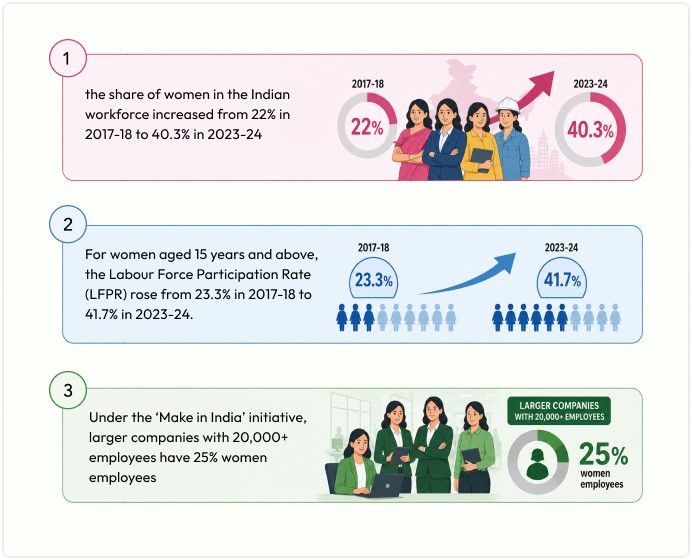
- Owing to the Make In India project, the share of women in the Indian workforce increased from 22% in 2017-18 to 40.3% in 2023-24. (ETBSFI)
- For women aged 15 years and above, the Labour Force Participation Rate (LFPR) rose from 23.3% in 2017-18 to 41.7% in 2023-24. (ETBSFI)
- In 2024, women’s workforce participation was 41% in hospitals & diagnostic labs, 34% in IT, and 26% in banking. (India Today)
- Under the ‘Make in India’ initiative, larger companies with 20,000+ employees have 25% women employees, while smaller firms with fewer than 500 employees have 15%. (India Today)
Other Significant Make In India Statistics
- In 2014, the manufacturing sector contributed approximately 16% to India’s GDP. By 2023, this share had modestly increased to 17.7%, indicating limited progress toward the initial target of 25% by 2025. (Down to Earth)
- As of September 2024, India has the third-largest startup ecosystem globally, with 148,931 DPIIT-recognized startups generating over 1.55 million jobs. (Vajiram & Ravi)
- During the tenure of Make In India, private companies produced goods worth $163 billion under the PLI scheme, achieving 90% of the target for the 2024/25 fiscal year. (Reuters)
- India’s defence exports hit an all-time high of INR 38,424 crore in FY 2025-26, a 62.66% jump over the previous year, with exports reaching 80+ countries. DPSUs contributed 54.84% of total exports. (Ministry of Defence, April 2026)
- Despite the PLI scheme, the manufacturing sector’s share in India’s economy dropped from 15.4% to 14.3% in FY2024-2025. (Reuters)
- By prioritizing high-value manufacturing and research, India’s global innovation ranking has risen from 81st in 2015 to 39th in 2025. (WIPO)
- Women now make up about 80% of the workforce in electronics manufacturing services (EMS), highlighting their significant role in this sector. (ETHR World)
- India’s UPI is now a global leader in digital payments, handling 46% of all real-time transactions worldwide. (Vajiram & Ravi)
- UPI processed 24,162 crore transactions worth INR 314 lakh crore in FY 2025-26, a 12,000-fold increase in volume from its first month in 2016. Daily transactions average ~66 crore across 703+ banks. (PIB / Ministry of Finance, May 2026)
- The IMF has acknowledged UPI as the world’s largest real-time payment system by volume. UPI accounts for around 48.5% of global real-time payment volumes and around 85% of India’s digital payment volume. (RBI Annual Report FY25)
- RBI plans to expand UPI to 20 countries by 2028-29. UPI is already live in 7 countries including Singapore, UAE, Sri Lanka, France, and Nepal. (RBI, 2026)
- India’s startup ecosystem ranks 3rd globally in 2025, with over 100 unicorns driving innovation and entrepreneurship.
- A 3.5% year-on-year rise in the Index of Industrial Production (IIP) was recorded in July 2025, driven by gains in manufacturing, mining, and electricity sectors, reflecting stronger industrial output. (
- India’s female labour force participation grew to 32.8% in 2021-22, with the prime working age group of 15 and beyond. (DGE)
- Merchandise exports reached US$349.35 billion during April-August 2025, marking a 6.18% year-on-year increase, while non-petroleum exports grew by 7.35%, showcasing robust momentum in manufacturing exports. (DD News)
- Tamil Nadu’s inclusive startup ecosystem grew six-fold from 2019 to 2025, with over 12,100 registered startups, half led by women, thus highlighting regional diversification beyond metros. (Drishti)