Infographics have become a vital part of how we communicate and consume information today. Instead of reading lengthy articles or analyzing complex data, people are naturally drawn to visuals that simplify information, making it easier to understand. In fact, infographics are 30 times more likely to be read than a complete article. This shows how powerful visuals have become in capturing attention.
Beyond just capturing attention, infographics also play a major role in driving engagement. In fact, 45% of online visitors click on a link if they know it contains an infographic. Additionally, Studies have shown that blog articles containing infographics generate 178% more inbound links.
In this blog, we will discuss the importance of infographic statistics, how they influence audience engagement, and why they have become an essential part of modern communication.
Infographic statistics (Editor’s Pick)
- 45% of online visitors click links that include infographics.
- Publishers who use infographics experience about 12% more website traffic compared to those who don’t.
- Infographics account for 36.6% of all visual content used across digital platforms today.
- Colored infographics boost reader attention and understanding by up to 82%.
- On Google, “infographics” and “infographic” are searched nearly 547,000 times each month.
- Content with images and graphics drives up to 650% higher engagement compared to text-only posts.
- Websites using infographics generate 12% more traffic than text-only platforms.
- Articles that include visuals receive 94% more views than those without any images.
Organizations using data visualization are 28% more likely to find essential project information
According to research, organizations that use data visualization are 28% more likely to find useful insights for their projects. This shows how visuals can make information clearer and more meaningful.
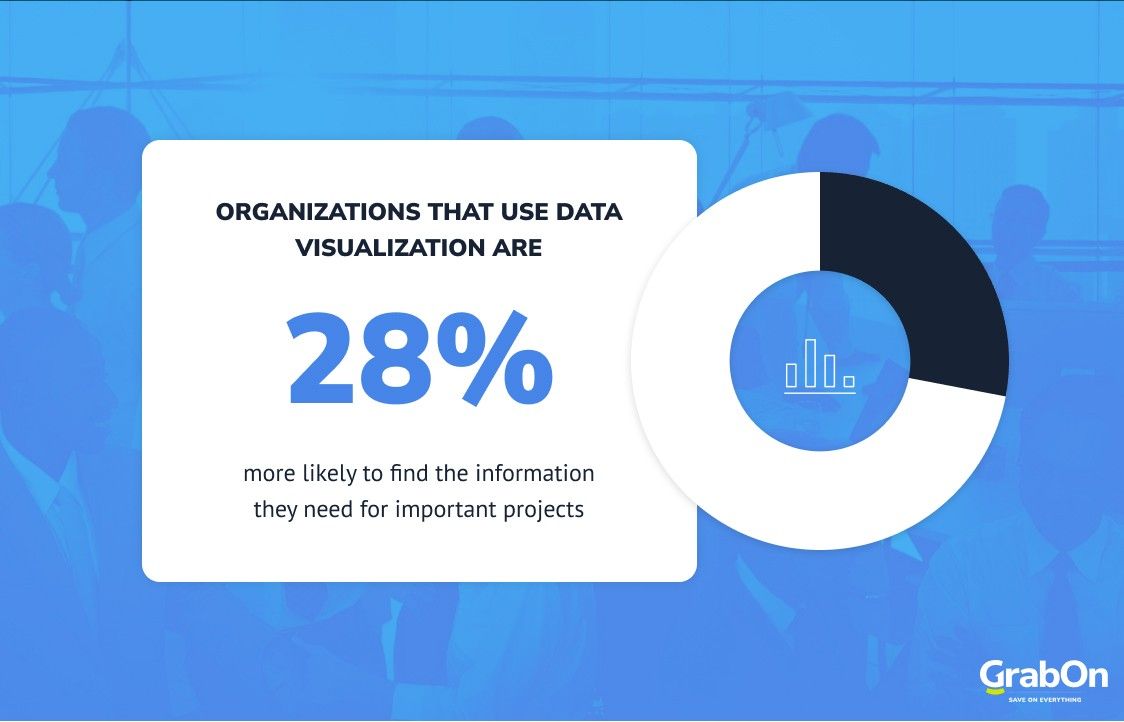
Source: Graphize
Nearly 37% of People Click on the First Link of Infographics
Around 37% of people click on the first link they see in an infographic. This shows how effectively infographics can guide viewers toward specific web pages or actions. They also support better SEO performance by keeping visitors on the page longer and reducing bounce rates.
Source: amraandelma
Content with images and graphics drives up to 65% higher engagement
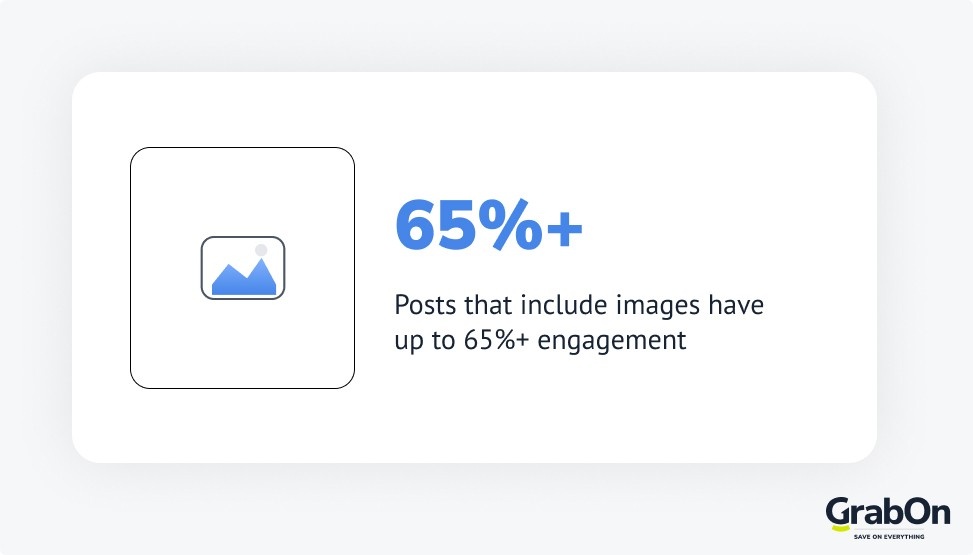
Content that includes images and graphics can get up to 65% more engagement than text-only posts. This happens because visuals make information clearer, more attractive, and easier for audiences to connect with.
Source: amraandelma
65% of brands use infographics in their content marketing strategy
6 out of 10 brands use infographics in their content marketing strategies. This shows the effectiveness of infographics in engaging audiences and conveying messages.
Source: amraandelma
Businesses using infographics are 28% more likely to find the information they need
Companies that use infographics are 28% more likely to access and understand the information they need. This shows how infographics transform complex data into clear visuals.
Source: amraandelma
Infographics can increase website traffic by 12%
Around 56% of marketers include infographics or other visuals in nearly all their content, and 55% prioritize social media graphics over other visuals. This highlights the key role visual content plays in capturing attention and keeping audiences engaged.
Source: Turelist
Retention Rates by Content Type
61% of viewers retain information better through infographics, making them the most effective content type for learning and comprehension.
Following infographics, commercials have a 55% retention rate, showing that combining visuals with audio also supports strong engagement and memory. PowerPoints come next at 48%. While text-only articles have only 38%, this indicates that plain text alone is less impactful. Blog posts rank the lowest at 36%, highlighting the need for visuals to make content more engaging and memorable.
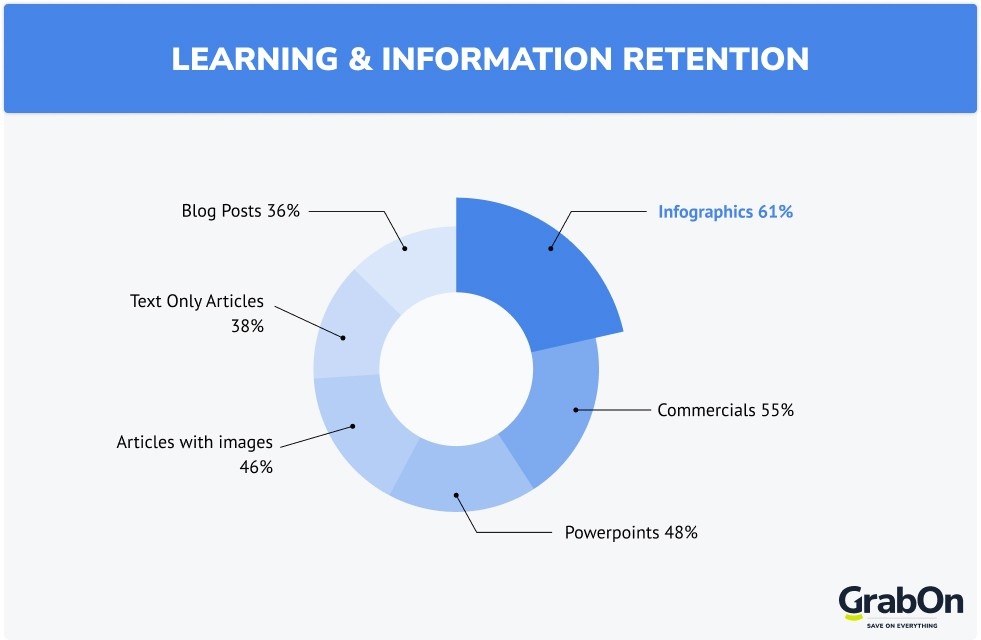
| Medium | Retention Rate (%) |
| Infographics | 61% |
| Commercials | 55% |
| Powerpoints | 48% |
| Articles with images | 46% |
| Text Only Articles | 38% |
| Blog Posts | 36% |
Source: Searchlogostics
Infographics Are 30 Times More Likely to Be Read and Shared
A well-designed infographic is 30 times more likely to be read than a regular article. This shows that including visuals with instructions or information makes it much easier for people to understand and follow.
Source: Turelist
Articles that contain infographics receive 178% more inbound links

Articles with infographics not only receive 178% more inbound links but also get more views than other posts. This increase in links reflects how valuable and shareable infographic-based content is, as it naturally attracts attention from other websites, social media platforms.
Source: embryo
Infographics are the second most valuable type of visual content
Infographics make up 36.6% of all visual content, making them the second most commonly used type of visual in digital media.

Source: theproductagency
Most Frequently Used Visual Content Formats by Marketers
About 33% of marketers who create visual content focus primarily on infographics and illustrations, making them the most frequently used visual format. Following infographics, stock photos are used by 30% of marketers.
Charts and data visualizations account for 15%, while videos are used by 13%. Multipage lead-generation documents make up 5%, indicating they are less commonly used compared to other visual formats.
Overall, the data shows that infographics and illustrations are the most preferred visual content formats because they effectively convey information in a clear, engaging, and easily shareable way.
| Content Formats | Most Frequently used (%) |
| Infographics | 33% |
| Stocks Photos | 30% |
| Charts & Data | 15% |
| Videos | 13% |
| Multipage Lead-en docs | 5% |
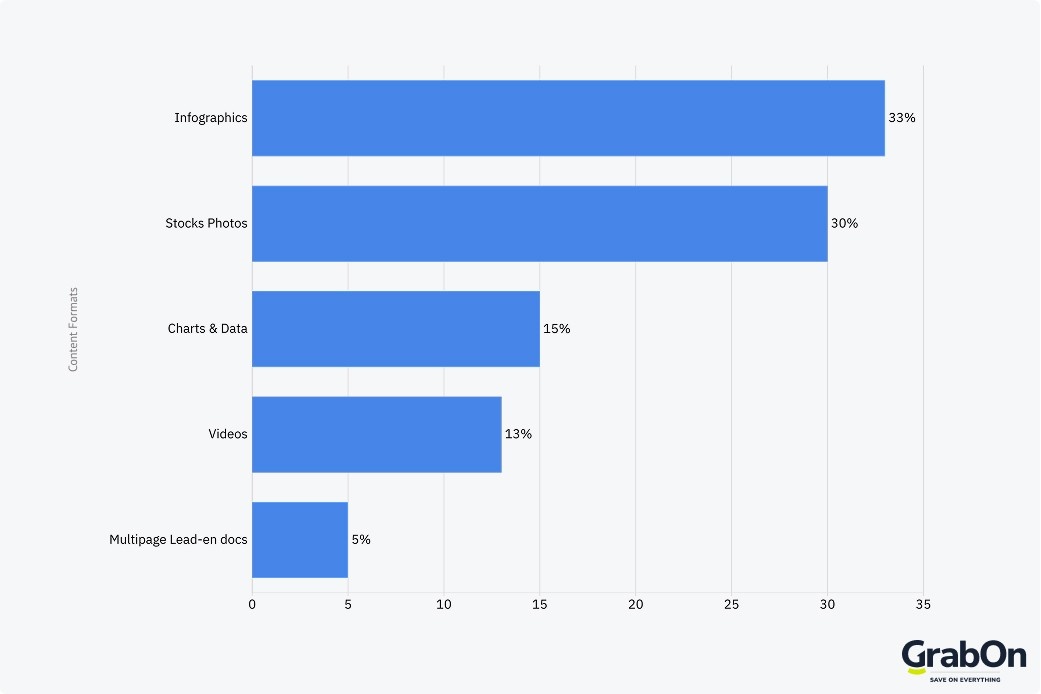
Source: Bloggingwizard
Most Companies Using Infographics Consider Them Effective
Around 56% of companies incorporate infographics into their content strategies, and of those, 84% find them effective.
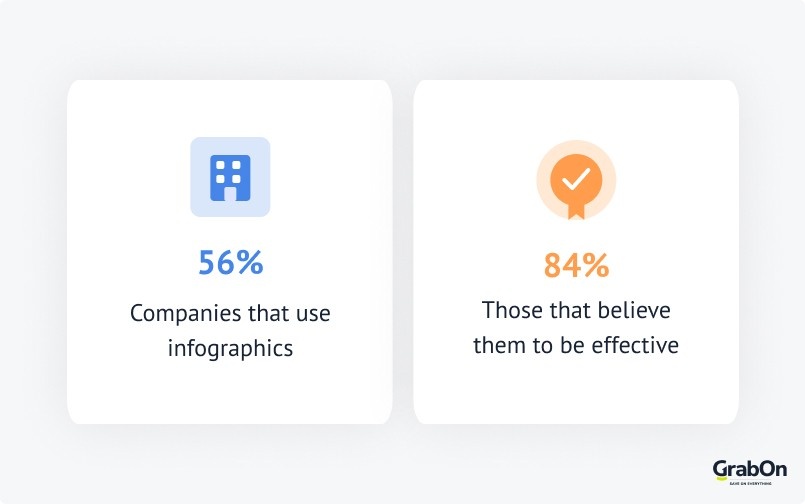
Source: Bloggingwizard
How Infographics Influence Consumer Behavior
Infographics encourage 57% of consumers to think more deeply about a subject. They also influence purchasing decisions, with 46% considering a product or service based on the information presented.
Infographics drive conversations, as 43% discuss the content with friends or family, and 43% may shift their opinions after seeing it. Even personal habits can be shaped, with 27% making lifestyle adjustments based on what they learn.
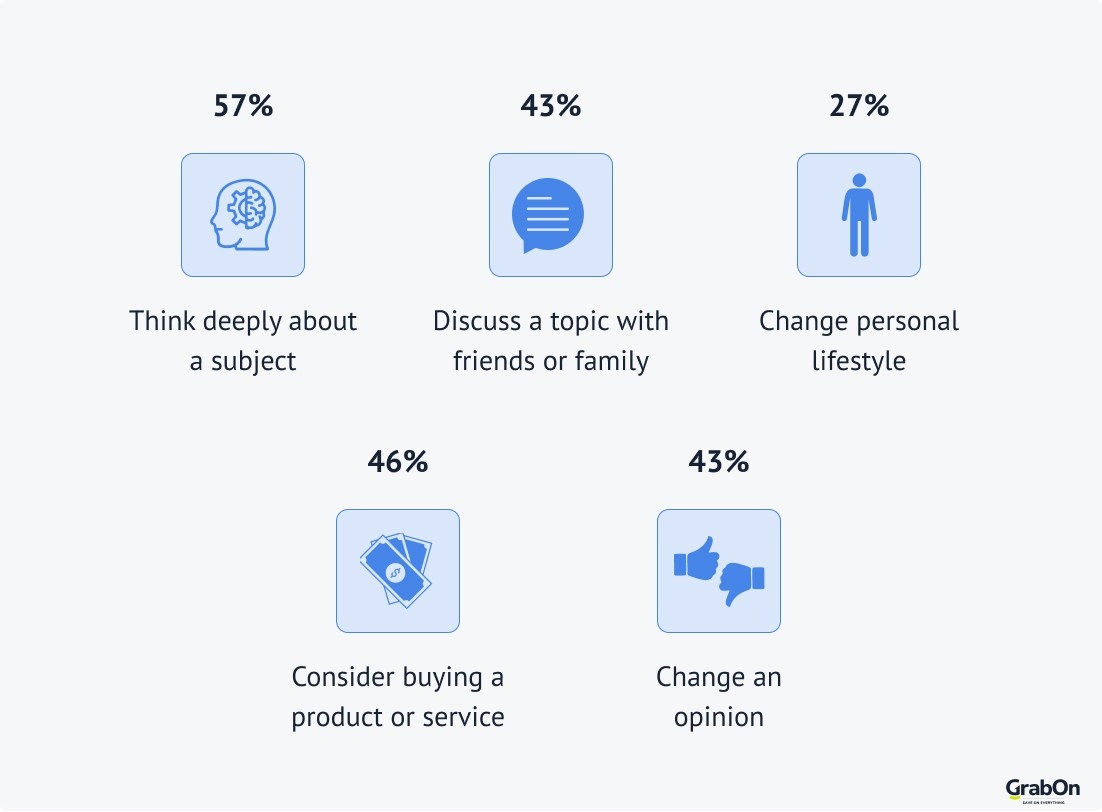
| Activity Influenced by Infographics | % of Consumers Influenced |
| Think deeply about a subject | 57% |
| Consider buying a product or service | 46% |
| Discuss a topic with friends or family | 43% |
| Change an opinion | 43% |
| Change personal lifestyle | 27% |
Source: Bloggingwizard
Static vs Animated Infographic
Animated infographics have a clear advantage over static ones in terms of retaining viewer attention,
driving engagement, and improving comprehension.
Viewer retention increases dramatically with animated infographics, reaching 70% compared to just 25% for static versions, showing a 45% improvement.
In terms of engagement, animated infographics achieve 2.5 times the baseline level compared to static content, a 150% increase. Overall, incorporating animation into infographics can greatly enhance their impact, making content more engaging, memorable, and easier to comprehend.
| Metric | Static Infographic | Animated Infographic | Improvemnt |
| Viewer Retention | 25% | 70% | +45% |
| Egagement | Baseline | 2.5x Baseline | +150% |
| Comprehension | 60% | 90% | +30% |
Source: Project Aeon
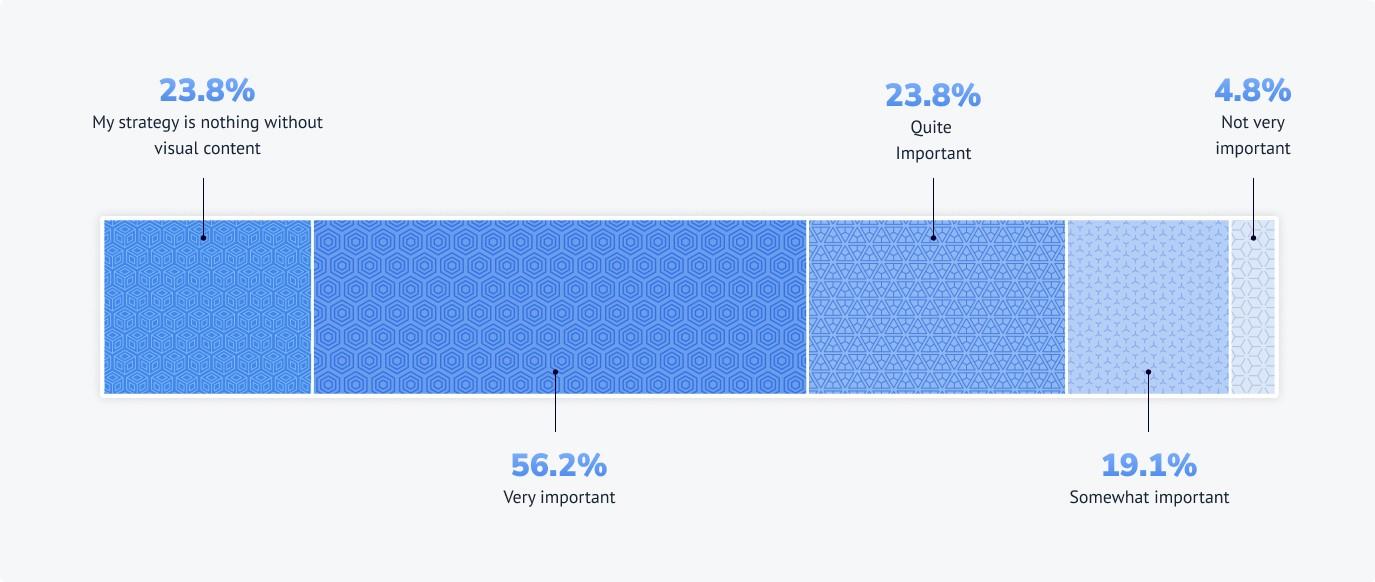
Importance Infographic In your Marketing Strategy
56.2% of marketers consider visuals very important for their marketing strategy for engaging audiences and communicating messages effectively. About 29.5% of marketers see visuals as quite important, highlighting the value of images and infographics in campaigns.
Around 23.8% feel their strategy cannot succeed without visual content, while 19.1% find it somewhat important, and only 4.8% think visuals are not very important. Overall, these numbers highlight that visuals are not just supplementary, they are an essential component of marketing strategies.
| What marketers think about Visuals for their Marketing strategy | % of marketers |
| Very Important | 56.2% |
| Quite Important | 29.5% |
| My Strategy is nothing without visual content | 23.8% |
| Somewhat Important | 19.1% |
| Not Very Important | 4.8% |
Source: Venngage
Infographic SEO Statistics
- Articles with infographics generate 178% more inbound links compared to standard articles, making them one of the most effective link-building content formats.
- “Why” posts, “What” posts, and infographics earn 25.8% more backlinks than videos and “how-to” guides, showing that data-driven and explanatory formats attract more citations.
- 91% of web pages without backlinks receive zero organic traffic from Google, making infographic-driven link acquisition a critical SEO strategy.
- Google displays image results for 27.9% of all searches, with nearly 32% of AIO clicks going to image blocks.
- Infographics with original research data earn 3 to 5 times more backlinks than infographics that curate existing statistics.
- Long-form content with infographics generates 3.5x more backlinks and 3x more traffic than average-length content.
Source: Embryo, Ahrefs, ClickRank.People remember 65% of information when presented in visual form
People remember 65% of information when it is presented visually, according to cognitive psychology studies. In contrast, they retain only 10% of information when it is delivered through hearing or plain text. This shows that infographics, videos, images, and even memes can make information more memorable and leave a lasting impact on your audience.
Source: infobranz
Power of Visual Content in Marketing
- 90% of information transmitted to the brain is visual.
- The brain processes visuals 60,000 times faster than text.
- Posts with visuals get 94% more views than text-only posts.
- Infographics are 3 times more likely to be shared on social media.
- Video content on landing pages can boost conversions by up to 80%.
Impact of Visuals on Consumer Engagement
- Emails with visuals have a 42% higher click-through rate.
- 67% of consumers are influenced more by clear visuals than product details or ratings.
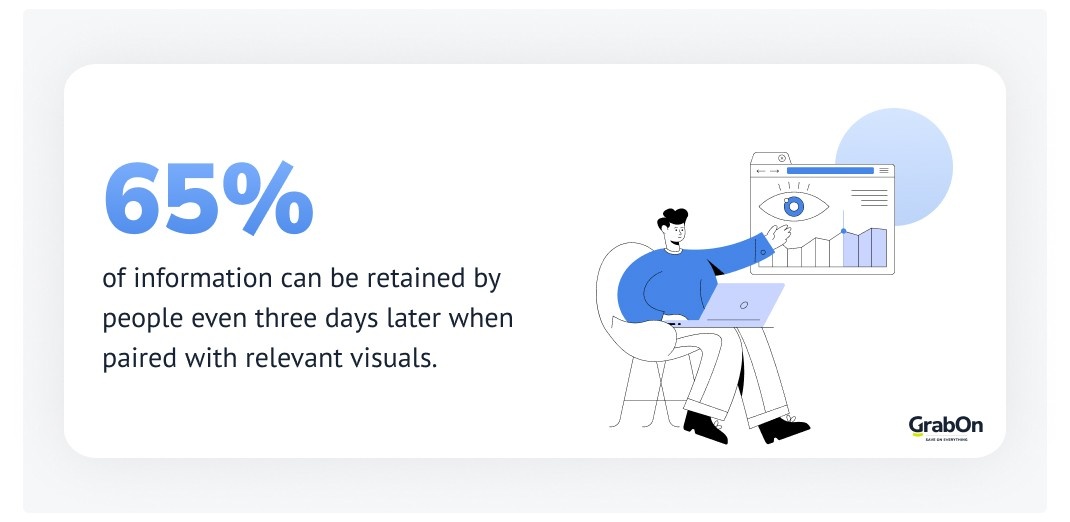
- 65% of people remember infographic content even 3 days later.
- Posts with visuals keep viewers engaged up to 10% longer.
- 53% of marketers use interactive infographics to engage their audience actively.
Emerging Trends in Visual Marketing
- 62% of young consumers prefer searching by image, driving platforms like Pinterest and Google to invest in visual search.
- Content readership increases by 80% when charts, images, or graphs are included.
- Facebook posts with images get 2.3 times more engagement than posts without visuals.
Efficiency and Decision-Making with Visual Data
- Decision-making speed increases by 28% when using data visualization tools.
- 18% higher revenue growth is reported by companies regularly using visual data.
- 72% of businesses access insights faster with modern data visualization tools.
- 70% of companies believe visual data significantly shapes business strategies.
- 90% of the information transmitted to the brain is visual.
Social Media Infographic Statistics
- Infographics on social media increase information retention by 10%.
- Infographics generate 3x more engagement on Facebook and Twitter.
- Instagram carousel posts get the highest engagement, followed by videos.
- Videos over 2 minutes are watched fully by only 50% of viewers.
- 1 in 3 Pinterest business owners earns $100k in revenue.
- YouTube is popular among teens aged 13–17.
Source: texttoinfographic, searchlogistics, 99firms, bloggingwizard, embryo, csgsolutions
84% of companies use infographics for marketing purposes
Around 8 out of 10 companies use infographics for marketing, making it the most common and impactful use case. Infographics also support sales, with 70% of companies using them to explain products, highlight benefits, and strengthen sales presentations.
Additionally, 59% use infographics for internal presentations, where visuals help teams understand data and ideas more quickly. For internal training, 43% of companies use infographics to make instructions clearer and learning materials easier to follow. Overall, this data shows that infographics are a versatile tool used across several business functions.
| Purpose | % of Businesses use Infographics for |
| Marketing | 84% |
| Sales | 70% |
| Internal Presentation | 59% |
| Internal Training | 43% |
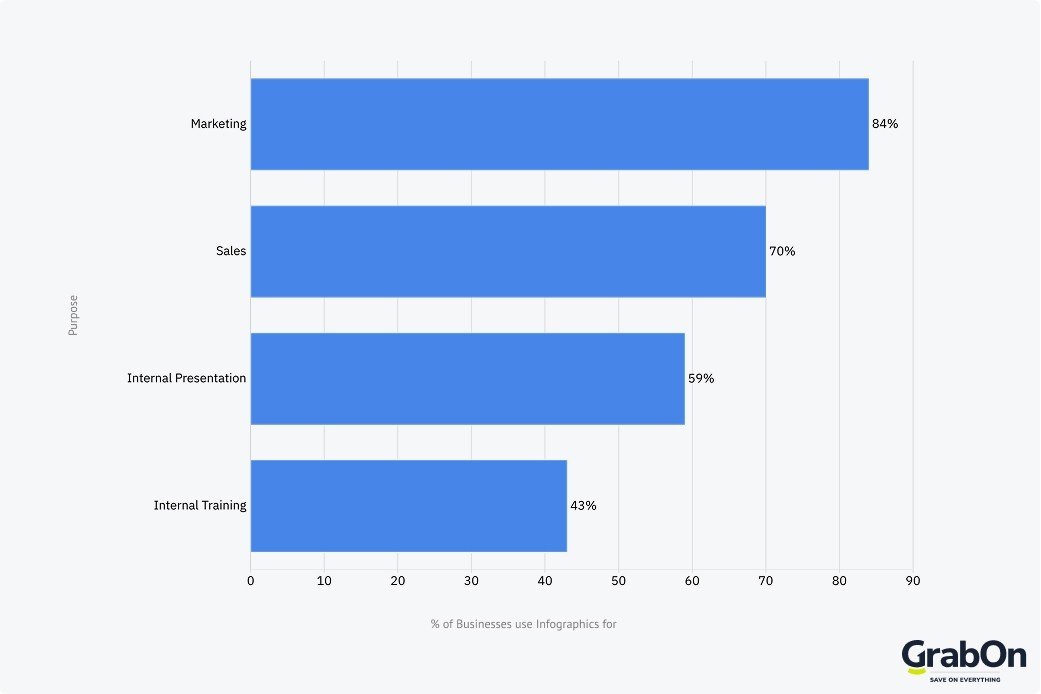
Source: bloggingwizard
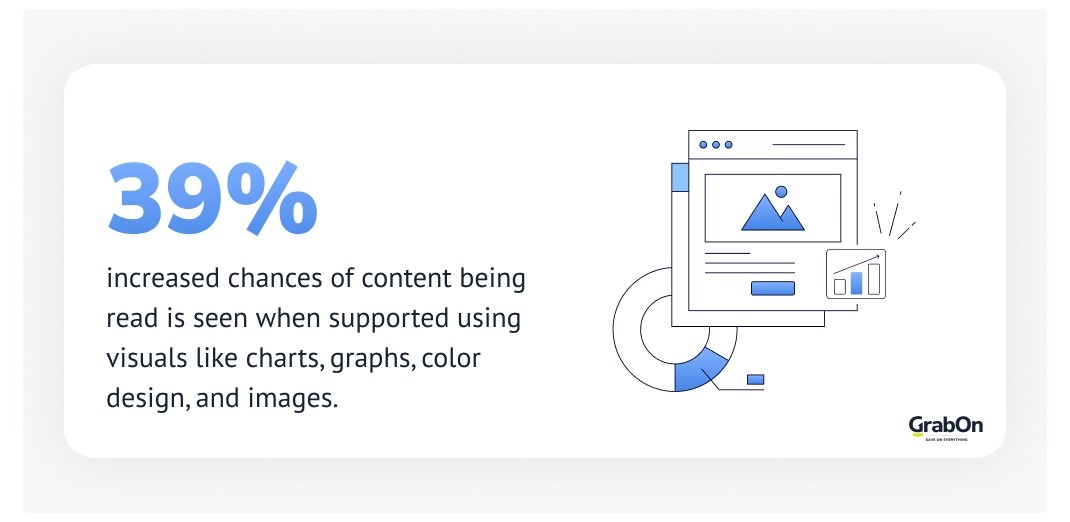
Visuals Boost Content Readability
Content is 39% more likely to be read when it includes visuals such as charts, graphs, color elements, and images. These visual aids make information easier to understand and help draw the reader’s attention more effectively.
Source: mindthegraph
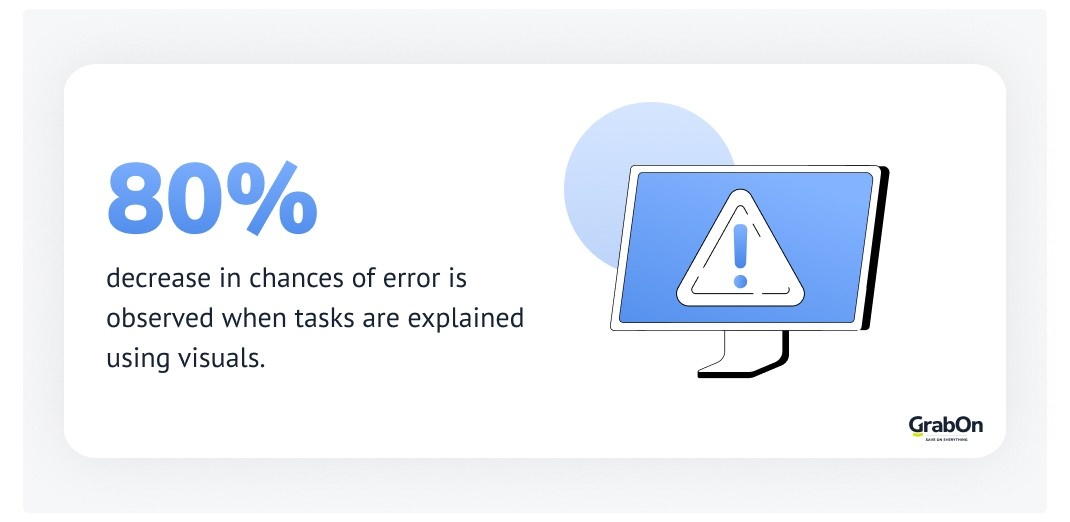
Visuals Can Reduce Errors by Nearly 80%
When tasks are explained using clear visuals, the chances of making mistakes drop by 80%. Visuals like diagrams, flowcharts, icons, and step-by-step illustrations make instructions easier to follow and help people understand processes more accurately.
Source: mindthegraph
Infographics vs. Text: Which Performs Better Online?
Infographics stand out with 94% more views, three times more social shares, and a 65% retention rate after three days, making them highly effective for boosting visibility and engagement.
Text content, however, plays an important role in long-term strategy. It performs better in SEO, contributes to over half of all online content discovery, and maintains a 10% retention rate after three days.
Overall, the table shows that both content types have their advantages. Infographics excel in engagement and retention, while text performs strongly in search and cost efficiency.
| Content Type | Key Performance Metrics |
| Infographics |
|
| Text Content |
|
Source: text2infographic
Measuring Success: Text vs Infographic
Infographics clearly stand out as a stronger communication tool when compared to plain text, delivering better results across almost every key metric. They draw in 54% more readers, making them far more effective at grabbing interest.
When it comes to information retention, the difference is even clearer. Readers remember only 10% of text after three days, while infographics help them retain 65%.
Overall, the data shows that while text is essential for depth and search performance, infographics elevate content by making it more engaging, memorable, and shareable.
| Metric | Text | Infographic |
| Reader Reach | Baseline | 54% more readers |
| Information Retention | 10% after 3 days | 65% after 3 days |
| Social Media Shares | Baseline | 3x more shares |
| Click-Through Rate | 1.6% | 2% |
| New Referring Domains | 1.8 per month | 3.1 per month |
Source: text2infographic
Key Takeaways
Infographics make one thing clear. Visual content isn’t just a creative choice. It’s a strategic advantage. From higher engagement and better retention to stronger social performance and improved website traffic, infographics consistently deliver more impact than text alone. As digital spaces grow more crowded, visuals give brands and creators a clear advantage by making their message easier to understand and more enjoyable to consume.