

India’s tourism industry has witnessed remarkable growth, attracting billions of domestic travelers and millions of international visitors each year. With a 1.5% share in global tourism, India ranks as the 18th most visited country in the world.
Domestic tourism is booming, with Uttar Pradesh leading as the top destination, while international arrivals continue to recover post-pandemic. This report breaks down key tourism statistics, trends, and visitor demographics shaping India’s travel landscape.
India Tourism Statistics (Top Picks)
- India has 4.29 billion domestic tourists and 20.22 million international tourist arrivals in a year.
- India has a 1.5% share of global tourism and is the 18th most visited nation.
- 56.9% of International Tourist Arrivals (ITAs) in India cite “Indian diaspora” as their reason for travel.
- Uttar Pradesh is the most popular state for Indian domestic travelers, attracting 646.8 tourists.
Number of Domestic Tourists in India Over The Years
As per the latest available data from India’s Ministry of Tourism, the country had 4.29 billion domestic tourists in 2025, a 45.6% increase from the previous year.
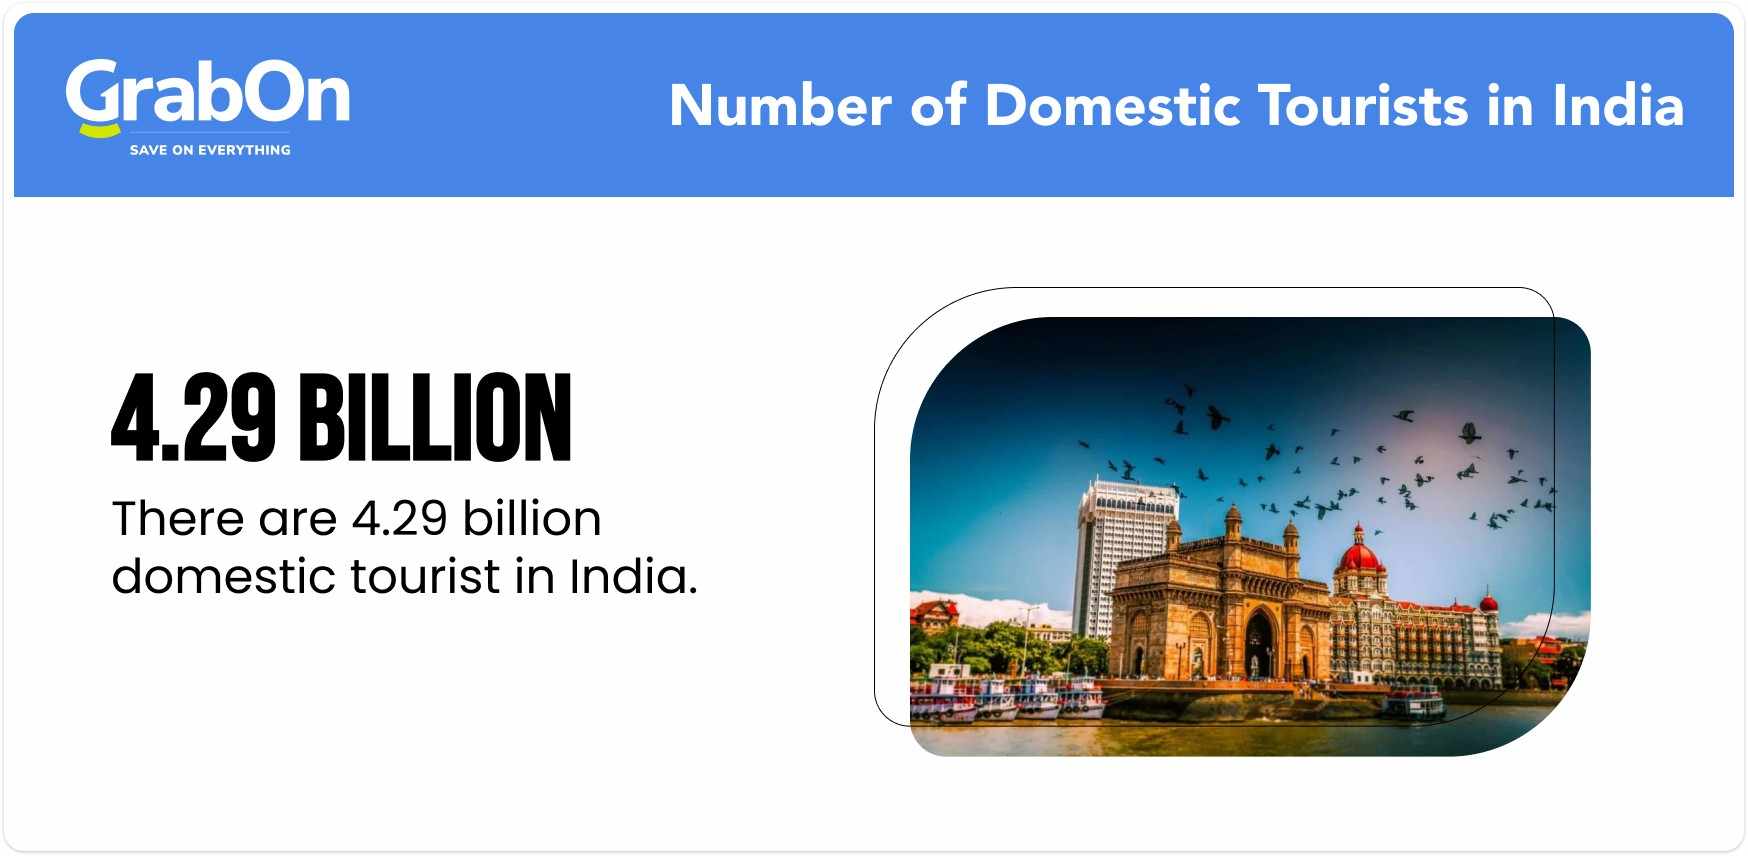
Here is a table showing the number of domestic tourists in India.
| Year | Number of India’s Domestic Tourists | Y-o-Y Change (%) |
| 2025 | 4.29 billion | +45.6% |
| 2024 | 2.90 billion | +15.5% |
| 2023 | 2.51 billion | +45.1% |
| 2022 | 1.73 billion | +154.4% |
| 2021 | 0.68 billion | +11.5% |
| 2020 | 0.61 billion | — |
India’s domestic tourist visits increased from 0.61 billion in 2020 to 4.29 billion in 2025, displaying an increase of around 603% in 5 years. This reflects the country’s rapid tourism recovery.
Source: India’s Official Tourism Data Report.
Top 10 Most Visited States in India by Domestic Tourists in 2024-2025
Uttar Pradesh is the most visited state in India, attracting around 646.8 million domestic tourists during 2024-2025. Tamil Nadu ranks second with 306.8 million domestic tourist visits, while Karnataka ranks third with 304.6 million visitors.
Uttar Pradesh, Tamil Nadu, Karnataka, Andhra Pradesh, and Rajasthan combined account for more than 60% of all domestic tourist visits in India.
Here is the table showing the top 10 Indian states with the highest domestic tourist visits:
| Rank | State | Domestic Tourist Visits (Million) |
| 1 | Uttar Pradesh | 646.8 |
| 2 | Tamil Nadu | 306.8 |
| 3 | Karnataka | 304.6 |
| 4 | Andhra Pradesh | 290.3 |
| 5 | Rajasthan | 230.1 |
| 6 | Maharashtra | 189.4 |
| 7 | West Bengal | 184.5 |
| 8 | Gujarat | 184 |
| 9 | Madhya Pradesh | 133 |
| 10 | Himachal Pradesh | 18 |
Source: India Tourism Data Compendium 2025
Most Visited Centrally Protected Monument (Ticketed) in India
-
By Domestic Tourists
The Taj Mahal is India’s most visited monument, attracting roughly 6.26 million domestic tourists each year. It is followed by the Sun Temple in Konark, with about 3.57 million visitors, and the Qutub Minar in Delhi, which has around 3.20 million visitors.
Here are the top 10 visited centrally protected monuments (Ticketed) in India by domestic tourists:
| Monument | State | Domestic Tourist Visits (Million) |
| Taj Mahal | Uttar Pradesh | 6.26 |
| Sun Temple, Konark | Odisha | 3.57 |
| Qutub Minar | Delhi | 3.2 |
| Red Fort | Delhi | 2.88 |
| Bibi ka Maqbara | Maharashtra | 2 |
| Ellora Caves | Maharashtra | 1.7 |
| Golconda Fort | Telangana | 1.58 |
| Agra Fort | Uttar Pradesh | 1.54 |
| Upper Fort Aguada | Goa | 1.35 |
| Charminar | Telangana | 1.34 |
-
By International Tourists
The Taj Mahal is also India’s most visited monument among international tourists, attracting around 0.64 million foreign visitors. It is followed by Agra Fort with 0.22 million visitors and Qutub Minar in Delhi, which also welcomed 0.22 million international tourists.
Here are the top 10 visited centrally protected monuments (Ticketed) in India by international tourists:
| Monument | State | International Tourist Visits (Million) |
| Taj Mahal | Uttar Pradesh | 0.64 |
| Agra Fort | Uttar Pradesh | 0.22 |
| Qutub Minar | Delhi | 0.22 |
| Humayun’s Tomb | Delhi | 0.15 |
| Chand Baori, Abhaneri | Rajasthan | 0.11 |
| Fatehpur Sikri | Uttar Pradesh | 0.09 |
| Itimad-ud-Daulah Tomb | Uttar Pradesh | 0.09 |
| Excavated Remains at Nalanda | Bihar | 0.08 |
| Red Fort | Delhi | 0.07 |
| Site of Sahet Mahet | Uttar Pradesh | 0.07 |
Source: Ministry of Tourism
Number of International Tourists Visiting India Over The Years
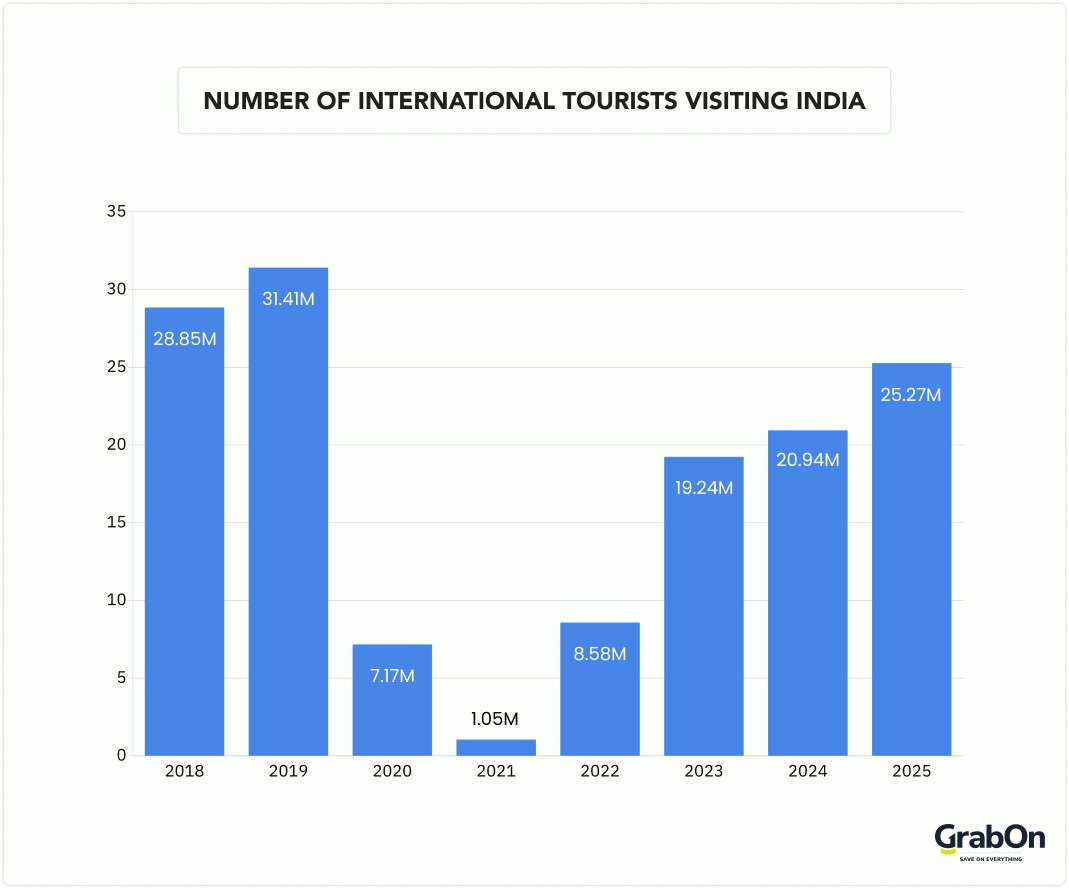
As per the latest reports from India’s Ministry of Tourism, the country had 25.27 million International tourists in 2025. The number for 2024 was 20.9 million.
India’s international tourism sector has experienced significant fluctuations over recent years, especially after the pandemic. In 2018, the country welcomed 28.85 million foreign tourists, a number that slightly increased to 31.41 million in 2019.
However, due to the COVID-19 pandemic restrictions, this number was reduced to 7.17 million in 2020 and decreased to 1.05 million in 2021.
As the world adapted to new norms and travel restrictions eased, India saw a resurgence in tourism, recording 8.58 million foreign tourist arrivals in 2022. This upward trend continued into 2023, with provisional figures indicating 19.24 million arrivals.
Let’s take a look at the number of international tourists arriving in India over the years:
| Year | Number of international tourists arriving in India |
| 2025 | 25.27 million |
| 2024 | 20.94 million |
| 2023 | 19.24 million |
| 2022 | 8.58 million |
| 2021 | 1.05 million |
| 2020 | 7.17 million |
| 2019 | 31.41 million |
| 2018 | 28.85 million |
Source: Ministry of Tourism
India’s Share in Global Tourism
India’s share in global tourism has seen fluctuations over the years, influenced by factors like the pandemic, economic recovery, and changing travel trends. In 2023, India welcomed 18.9 million international tourists, maintaining a 1.5% share of the global tourism market. This marks a strong recovery from 14.3 million in 2022, which had already seen a 104.3% surge compared to the previous year.

Before the pandemic, India’s share in world tourism hovered around 1.2%, with 17.4 million arrivals in 2018 and 17.9 million in 2019. However, in 2020, global travel restrictions led to a sharp decline, with arrivals dropping to 6.3 million, though the share briefly increased to 1.6%. As tourism rebounded, India’s ranking fluctuated, moving from 24th place in 2019 to 17th in 2022.
With global travel trends favoring emerging markets, India’s tourism sector is expected to continue growing, with international arrivals projected to reach 23.5 million in 2024. If this trend continues, India’s share in world tourism could further strengthen in the coming years.
Source: India’s Tourism Ministry Report.
India Is The 18th Most Visited Country In The World
India welcomed 19.24 million International tourists in 2023 and stood in the 18th position globally in terms of tourist visits.
France takes the top spot with 100 million ITAs. Spain and the US took the second and third positions with 85.2 million and 66.5 million ITAs, respectively.
With a 1.5% share in global tourism, India’s tourism industry is slowly and steadily heading towards a higher market share.
Source: India’s Tourism Ministry Report.
Top Source Countries For Foreign Tourists Arriving In India
22.3% of International tourists coming to India are from Bangladesh, which is equivalent to 22.2 lakh yearly tourists. ITAs from the United States of America account for 17.8% (16.91 lakh tourists). ITAs from the United Kingdom make up 9.5% of ITAs in India.
Here is a table showing the top 15 source countries for International Tourist Arrivals in India.
| Rank | Country | FTAs in India in 2023 | % Share in 2023 |
| 1 | Bangladesh | 21,19,826 | 22.30% |
| 2 | United States of America | 16,91,498 | 17.80% |
| 3 | United Kingdom | 9,20,591 | 9.70% |
| 4 | Australia | 4,56,167 | 4.80% |
| 5 | Canada | 3,85,938 | 4.10% |
| 6 | Sri Lanka | 2,80,327 | 2.90% |
| 7 | Malaysia | 2,62,458 | 2.80% |
| 8 | Germany | 2,23,575 | 2.30% |
| 9 | Nepal | 1,95,445 | 2.10% |
| 10 | France | 1,88,981 | 2.00% |
| 11 | Singapore | 1,83,772 | 1.90% |
| 12 | Russian Federation | 1,64,125 | 1.70% |
| 13 | Japan | 1,50,521 | 1.60% |
| 14 | Thailand | 1,16,060 | 1.20% |
| 15 | Italy | 1,16,031 | 1.20% |
Source: India’s Tourism Ministry Report.
Reasons For International Tourists Visiting India
56.9% of International Tourist Arrivals (ITAs) in India cite “Indian diaspora” as their reason for travel, which means that more than half of foreign visitors to India are people of Indian descent returning for purposes like visiting family and relatives, attending cultural or religious events, exploring their ancestral roots, medical treatments, or business trips.
33.8% of ITAs cite “Leisure Holiday” as their reason for visit, while 6.3% of ITAs arrive in India for a Business trip.
Source: India’s Tourism Ministry Report.
Demographics of International Tourists Arriving in India
54.98% of international tourists arriving in India are males, while 45.02% are females.
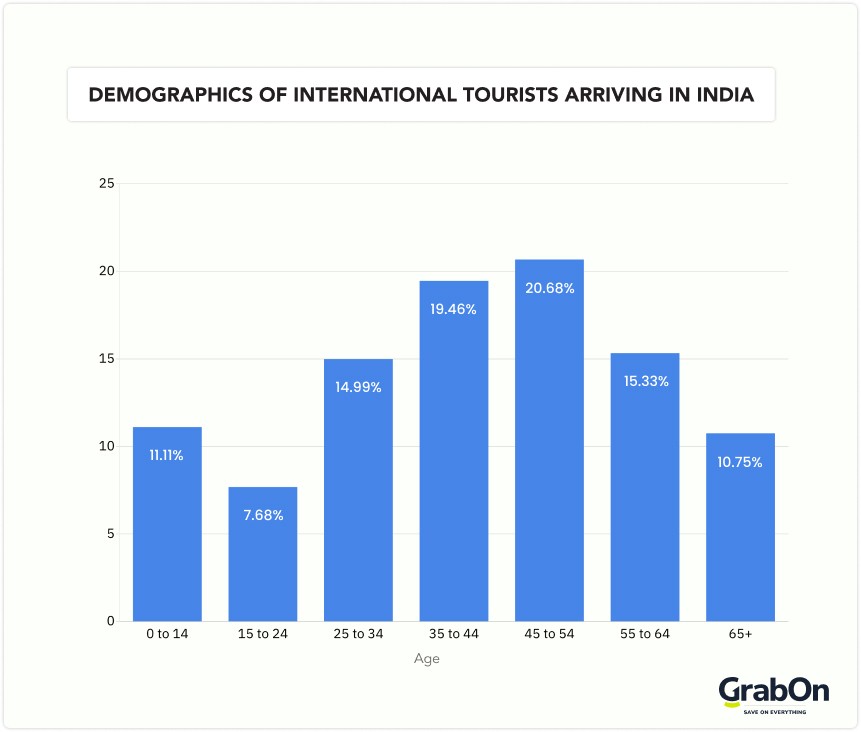
People aged 45 to 54 make up 20.68% of ITAs. People aged 1 to 14 years make up 11.11%; these are the kids coming along with their parents on a trip.
Here is a table showing the age group of international tourists arriving in India.
| Age group | Share of ITAs |
| 0 to 14 | 11.11% |
| 15 to 24 | 7.68% |
| 25 to 34 | 14.99% |
| 35 to 44 | 19.46% |
| 45 to 54 | 20.68% |
| 55 to 64 | 15.33% |
| 65+ | 10.75% |
Source: Ministry of Tourism
Preferred Mode of Transport for Arriving in India for Foreign Tourists
Most tourists (79.4%) arrive by air, followed by land (20.1%) and sea (0.5%). In comparison, 2022 saw 83.5% of arrivals by air, 16.2% by land, and 0.3% by sea.
Tourists entering India by land mainly came from Bangladesh and Pakistan. Air travel has consistently been the most popular choice, with over 79% of FTAs arriving by air each year. Land routes have accounted for more than 10% of arrivals from 2014 to 2023, while sea travel has remained below 1% since 2011, except in 2020, when it briefly rose to 1.5%.
Source: India’s Tourism Ministry Report.
Tourism Share in the Indian GDP Over the Years
For the financial year 2023-2024, the tourism sector contributed roughly 5.22% to India’s GDP. The sector’s GDP share dropped sharply during the COVID-19 pandemic, falling from 5.18% in 2019-2020 to 1.49% in 2020-2021 and 1.74% in 2021-2022.
Interestingly, the tourism sector’s share in India’s GDP has consistently contributed over 5% since 2017, except for the two pandemic-hit years.
The table below showcases the tourism sector’s contribution to India’s GDP over the years:
| Financial Year | Tourism Share in India’s GDP |
| 2023–2024 | 5.22% |
| 2022–2023 | 5.09% |
| 2021–2022 | 1.74% |
| 2020–2021 | 1.49% |
| 2019–2020 | 5.18% |
| 2018–2019 | 5.01% |
| 2017–2018 | 5.03% |
This tourism boost in India has also helped increase the number of hotels and resorts across the country. Recent reports suggest that around 64% of new branded hotels are opening in smaller Tier-II and Tier-III cities.
Travel platforms like Thrillophilia, MakeMyTrip, and others have also introduced new packages for domestic and international tourists at affordable prices, helping them plan their itineraries effectively. Tourists also constantly search for exclusive platform deals, such as coupons for Thrillophilia and others, to make their trips more cost-effective.
Source: Ministry of Tourism
Jobs Created in India via Tourism
India’s tourism sector created roughly 84.63 million jobs in 2023-2024, including 36.9 million direct jobs and 47.73 million indirect jobs. This is around an 11.11% increase from 76.17 million jobs created in 2022-2023.
Here is how many direct and indirect jobs were created via the tourism sector in India over the years:
| Financial Year | Direct Jobs (Million) | Indirect Jobs (Million) |
| 2023–2024 | 36.9 | 47.73 |
| 2022–2023 | 33.22 | 42.95 |
| 2021–2022 | 30.55 | 39.49 |
| 2020–2021 | 29.68 | 38.38 |
| 2019–2020 | 30.28 | 39.16 |
| 2018–2019 | 33.08 | 42.77 |
Source: Ministry of Tourism
Additional India Tourism Statistics
- The Union Budget 2025-26 has allocated ₹2541.06 crore to enhance infrastructure, skill development, and travel facilitation.
- Medical tourism and wellness retreats attract 21% of international visitors by offering top-quality healthcare and traditional healing therapies.
- India’s travel market is expected to grow from $75 billion in FY20 to $125 billion by FY27.
- Travel and tourism are major industries in India, contributing $199.6 billion to the country’s GDP.
- India is estimated to have around 165k hotel rooms, which are estimated to reach 200k by 2027.