
This report is built on over 24 million coupon interactions recorded on GrabOn between 1 July 2025 and 30 June 2026. It is the closest look we have published yet at how a connected nation of over 1 billion internet users actually looks for savings, and it is based on what shoppers did, not what they told a survey.
What we found changes the usual story. Summer, not Diwali, is peak deal-hunting season. The busiest day of the year was not a sale launch but a cricket match. The Diwali hunt is fought and won four weeks before Diwali itself. Nearly 85 out of every 100 searches happen on a phone. And what shoppers really want is not more codes but codes that work, because about half the time spent hunting is wasted on ones that do not.
Behind all this behaviour sits the bigger picture. India’s e-commerce market is set to grow from $182 billion to $345 billion by 2030, with its fastest growth still ahead. Yet only about half the people who own a smartphone have ever made a purchase online. That leaves roughly 348 million Indians who are connected but have not started shopping online yet, and for them a discount is not a bonus at checkout; it is the reason to start. This report maps where that journey begins.
Key Findings Of The Study
- 01The global digital coupons market is estimated at $12.55 billion in 2026 and is projected to reach $40.75 billion by 2033, a 3.2x expansion at an 18.33% CAGR.
- 02Nearly 342 million Indians shop online as of 2026, with the base projected to reach 420 million by 2030.
- 03Online shoppers in rural India are growing at a 22% CAGR against 15% in urban India.
- 04Summer, not the festive season, is peak deal-hunting in India. April and May outpull the October to December festive quarter by around 13% on daily coupon demand.
- 05India vs Pakistan at the Asia Cup on 14 September 2025 was the single biggest deal-hunting day of the year, running at 134% of a normal day.
- 06The Diwali deal-hunt happens roughly four weeks before Diwali. Demand bottomed at 70% of baseline on Diwali day itself.
- 0784.6% of India’s coupon searches happen on a mobile device.
- 08The needs of daily life, travel, food delivery, fashion and grocery, account for over 55% of India’s coupon demand. Electronics, the stereotype coupon category, is under 3%.
- 09Salary day is visible in the data: days 1, 2 and 14 of the month run about 4% hot, while the 19th to the 27th run 2 to 4% cold.
The Market Context
Before the behaviour, the ground it stands on: how large the coupon economy is globally, how fast India’s e-commerce and shopper base are expanding, and who owns discount discovery in this country.
Sections 01 – 05 · Independent market dataSection 01 / 16
Global Digital Coupons Market Size (2026 to 2033)
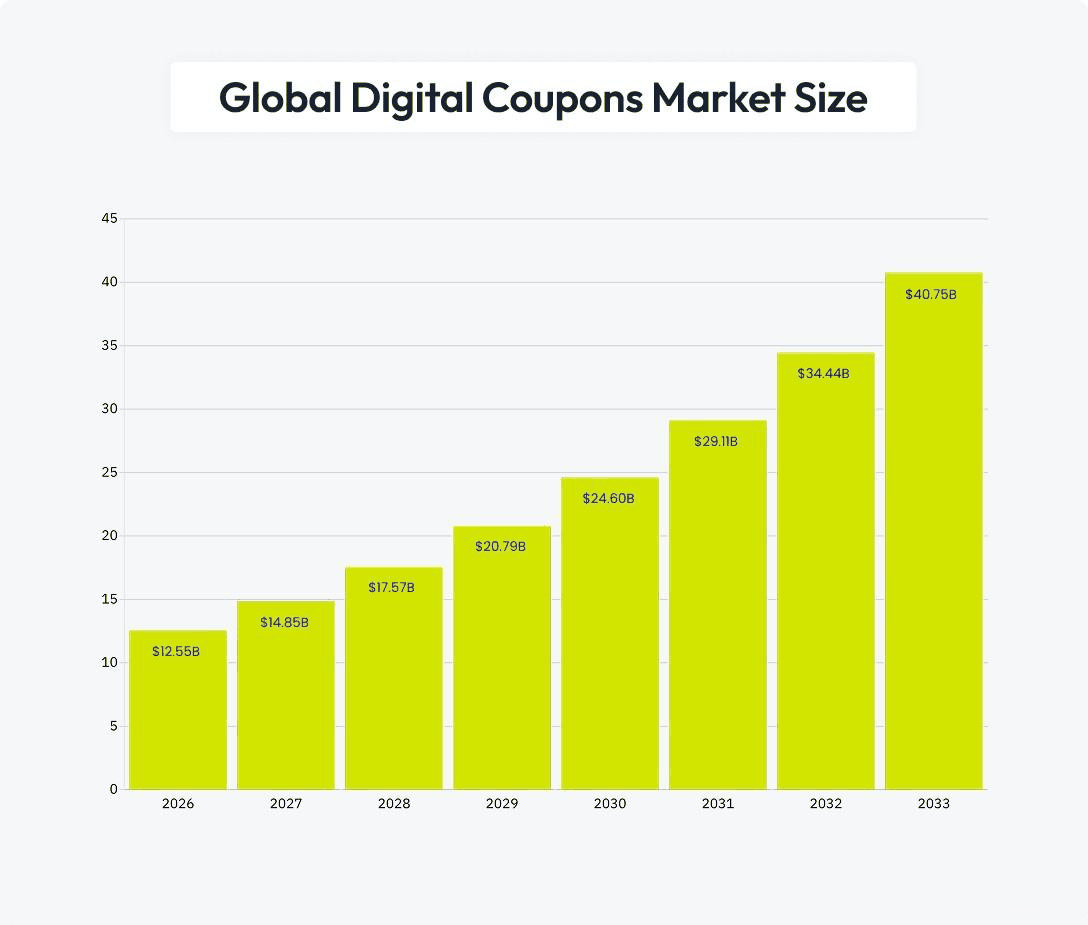
The global market for digital coupons is estimated at $12.55 billion in 2026 and is projected to reach $40.75 billion by 2033, growing at a CAGR of 18.33%.
That trajectory implies the market will more than triple, adding roughly $28 billion in value over seven years. The global digital coupon market has experienced significant growth in recent years, driven by the widespread use of smartphones and increased internet access. The COVID-19 pandemic played a crucial role in accelerating this growth, as businesses began using digital coupons to boost online sales. During the pandemic, demand for e-coupons surged, particularly for groceries, meal kits, streaming services and health-related products.

| Year | Market Size |
|---|---|
| 2026 | $12.55 billion |
| 2027 | $14.85 billion |
| 2028 | $17.57 billion |
| 2029 | $20.79 billion |
| 2030 | $24.60 billion |
| 2031 | $29.11 billion |
| 2032 | $34.44 billion |
| 2033 | $40.75 billion |
Two structural shifts are sustaining the curve. First, the integration of digital coupons with mobile wallets and payment apps has improved the customer experience, making discounts easier to store, surface and redeem at checkout. Second, subscription services offering exclusive deals and collaborations with influencers have expanded the market by providing personalised offers and a sense of exclusivity for consumers.
Source: Business Research Insights. Growth multiple (3.2x) is a GrabOn calculation from the same series.
Section 02 / 16
India’s E-commerce Industry Size
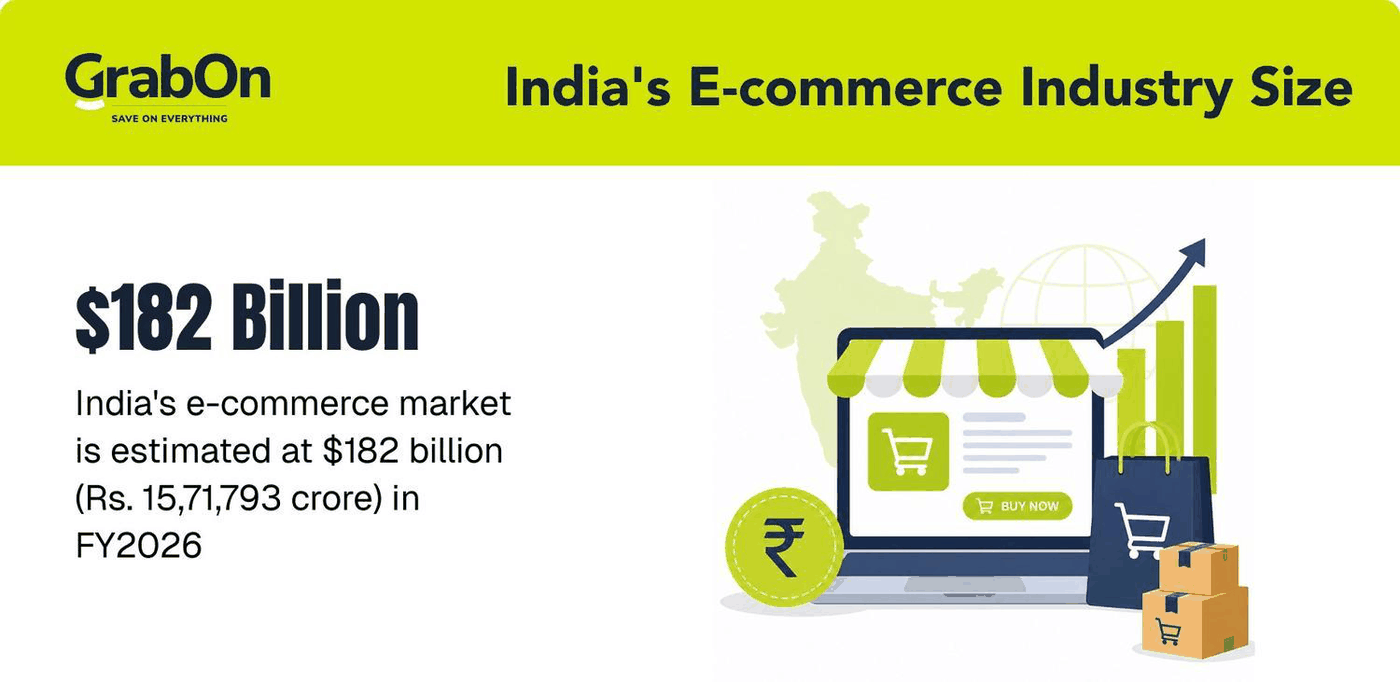
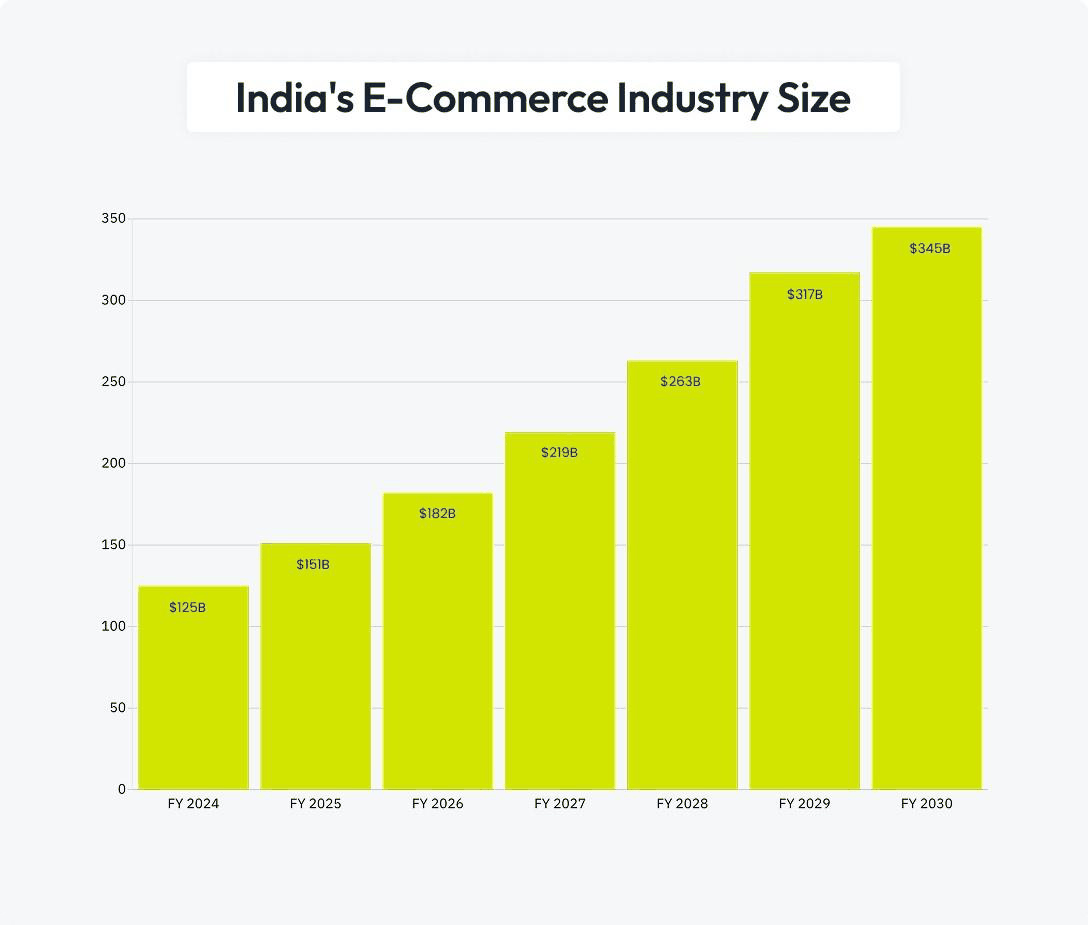
India’s e-commerce market is estimated at $182 billion (Rs. 15,71,793 crore) in FY2026, up from $151 billion in FY2025, a year-on-year rise of about 20%.
The market has expanded from $125 billion in FY2024 to a projected $345 billion by FY2030, growing roughly 2.76 times over six years at a compound annual rate of about 18.4%.
| Fiscal Year | Value in INR | Value in USD |
|---|---|---|
| FY 2024 | Rs. 10,82,875 crore | $125 billion |
| FY 2025 | Rs. 13,04,703 crore | $151 billion |
| FY 2026 | Rs. 15,71,793 crore | $182 billion |
| FY 2027 | Rs. 18,94,210 crore | $219 billion |
| FY 2028 | Rs. 22,82,634 crore | $263 billion |
| FY 2029 | Rs. 27,51,234 crore | $317 billion |
| FY 2030 | Rs. 29,88,735 crore | $345 billion |
F: Forecasted. USD converted at approximately Rs 86.5/USD.
What makes FY2026 significant is not the number itself but where it sits on the curve. From the current $182 billion the market is projected to nearly double to $345 billion by FY2030, meaning the steepest stretch of India’s e-commerce growth is not behind us; it begins now. That pace closely tracks the roughly 18% annual expansion of the global digital coupons market, so discount-led shopping is scaling in lockstep with commerce itself, not lagging behind it.
The growth continues to be driven largely by tier-2 and tier-3 city adoption, and the headroom remains substantial. Online retail accounted for about 7% of India’s total retail in 2024 and is estimated to reach 14% by 2030, according to IBEF. Every percentage point of that shift moves more of India’s discount economy from newspaper inserts and in-store promotions to digital codes, deals and cashback, which is the terrain this report measures.
Source: Online retail share of total retail: India Brand Equity Foundation (IBEF), 2025. CAGR is a GrabOn calculation from the published endpoints.
Section 03 / 16
India’s Online Shopper Base
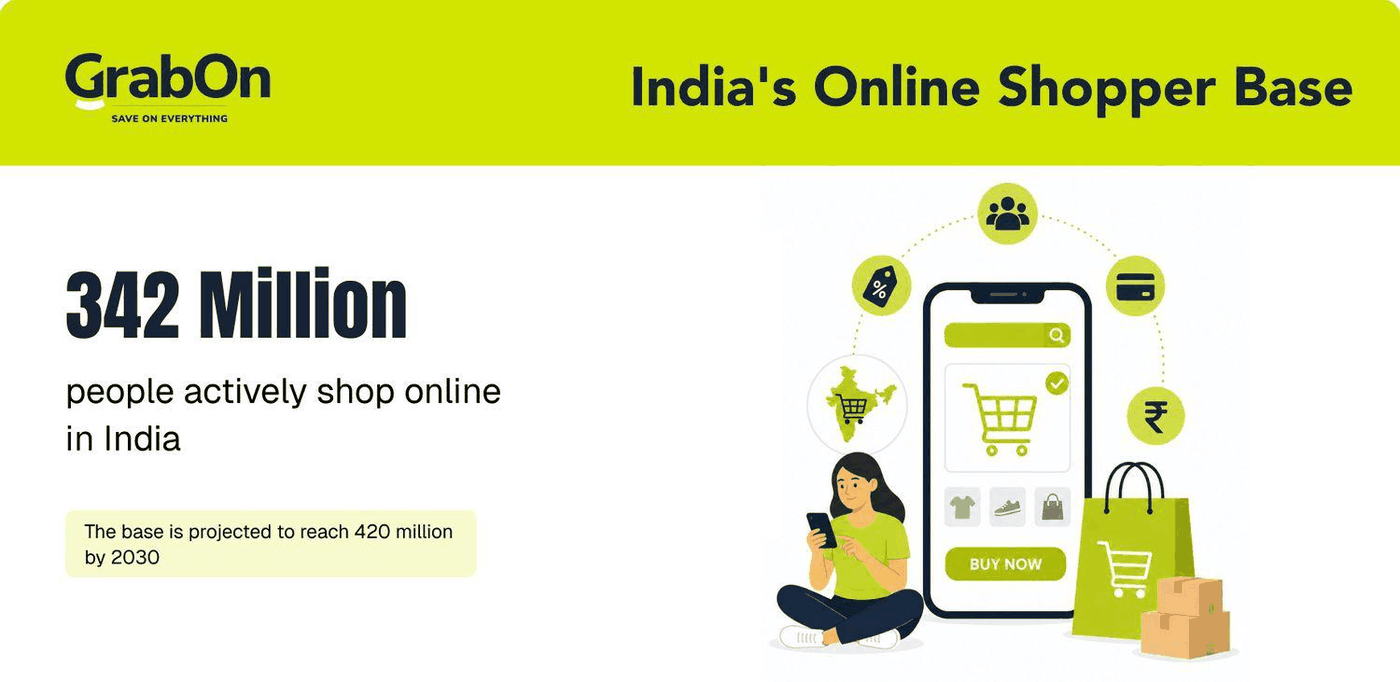
Nearly 342 million Indian individuals actively shop online as of 2026.
There has been a net addition of 80 million digital shoppers in the last three years, roughly 26.6 million new shoppers every year since the beginning of 2022. The base is projected to reach 420 million by 2030, which implies around 19.5 million net additions per year from here, a slower but broader curve as growth shifts from metros to smaller towns.
| Indicator | Value |
|---|---|
| Active online shoppers, 2026 | 342 million |
| Net shopper additions, 2022 to 2026 | 80 million (20 million per year) |
| Projected online shoppers, 2030 | 420 million |
| Rural online shoppers, FY19 to FY26 CAGR | 22% (to 88 million) |
| Urban online shoppers, FY19 to FY26 CAGR | 15% (to 263 million) |
| Active internet users in India, 2024 | 886 million (55% rural) |
Two features of this audience matter for the savings economy. First, rural India now accounts for 55% of the country’s internet population and is adding online shoppers at a faster clip than urban India, so the coupon audience of the next five years will be markedly less metropolitan than the one of the last five. Second, with 886 million active internet users against 342 million online shoppers, roughly six in ten Indians online are yet to transact, and price assurance in the form of discounts, coupons and cashback remains the most proven lever for converting them.
Source: IBEF, E-commerce Industry in India (2025); IAMAI-Kantar, Internet in India Report 2024. Per-year run rates are GrabOn calculations from the published totals.
Section 04 / 16
The Savings Economy: Cashback and Rewards in India
Cashback spending in India is forecast to reach $14.28 billion by 2029, growing at a 13.4% CAGR.
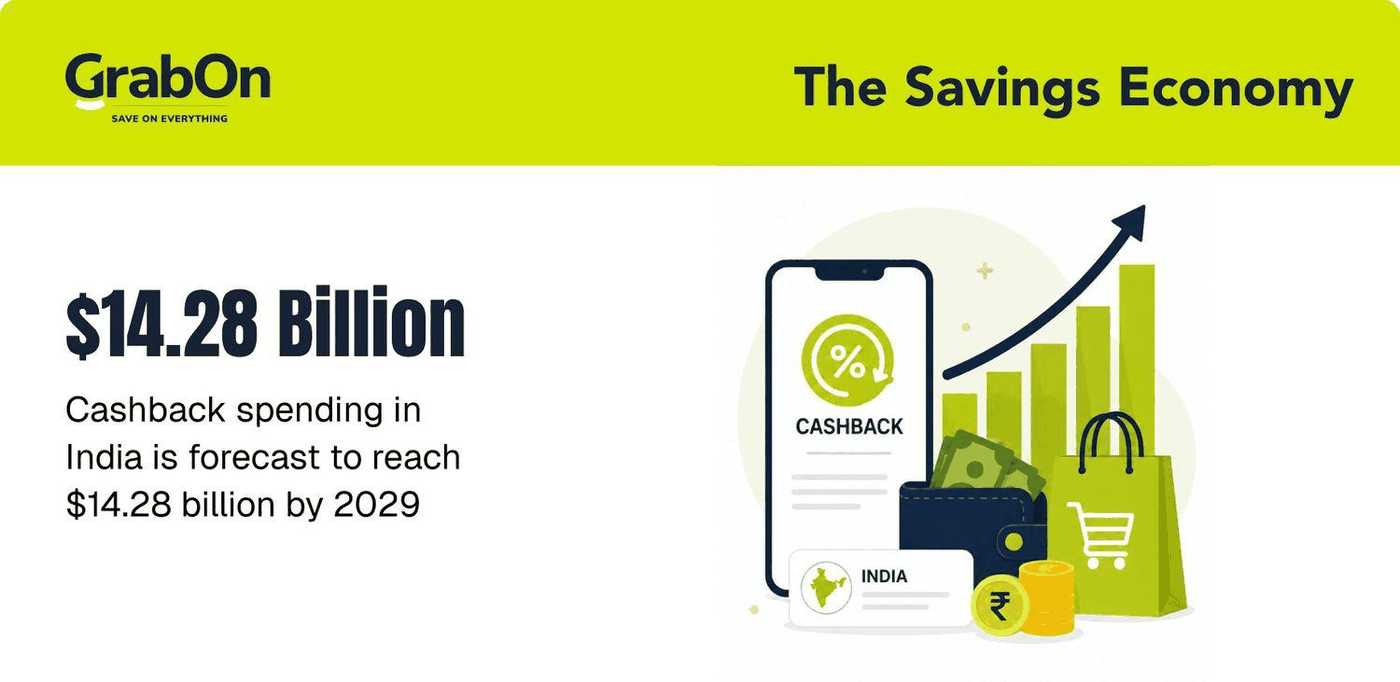
The cashback economy has moved from marketing gimmick to measurable industry. ResearchAndMarkets’ India Cashback Programs Databook (2024) projects cashback spending in the country to reach $14.28 billion by 2029 at a 13.4% compound annual growth rate, driven by digital payments adoption, rising consumer price sensitivity and personalisation through data analytics.
Underneath both coupons and cashback sits the UPI rail. UPI transactions stood at 24,162 crore in volume and Rs 314 lakh crore in value in FY 2025-26, with PhonePe, Google Pay and Paytm accounting for 85% of India’s digital payments. Instant, zero-friction payment is what makes instant, zero-friction savings possible: a coupon applied at a UPI checkout settles in seconds, and that immediacy is a structural advantage India’s savings economy holds over most markets.
| Indicator | Value |
|---|---|
| India cashback spending, 2029 forecast | $14.28 billion |
| India cashback market CAGR, 2024 to 2029 | 13.4% |
Source: ResearchAndMarkets, India Cashback Programs Market Databook 2024; Indian Startup News, CashKaro FY25 results; IBEF citing NPCI, UPI performance FY225-26.
Section 05 / 16
India’s Coupon Platform Market Share
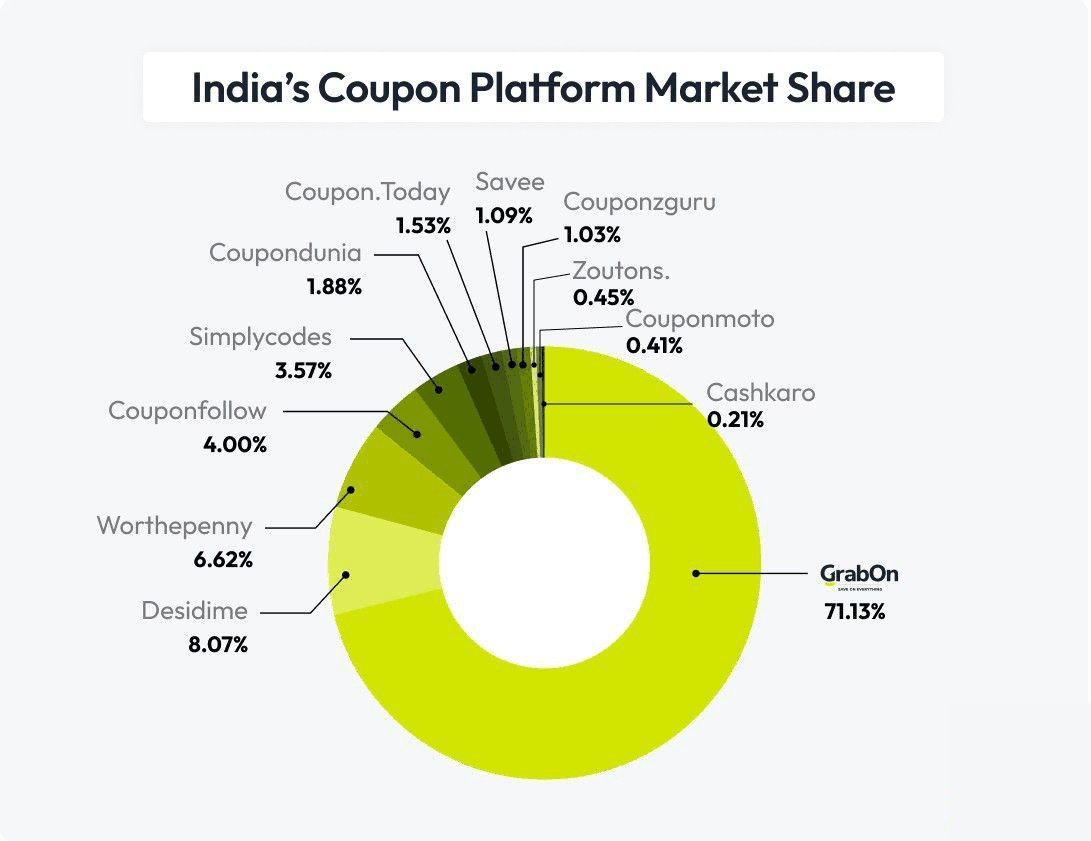
Because 84.6% of coupon discovery in India happens on mobile search, first-position search visibility is the single most consequential distribution asset in this category: the platform that owns the first result effectively owns the moment of intent. The long tail below the top three indicates a consolidating market in which scale in merchant coverage and code verification compounds into search authority.
Methodology. This study tracks over 5,130 keywords. Search visibility share measures relative ranking strength, not traffic or revenue. For each listed platform, share is calculated by dividing the number of tracked keywords for which that platform ranks first on search by the total first-position rankings across all selected competitors. The analysis is intended for competitive benchmarking; it compares only the listed platforms and does not represent the complete search landscape.
| Rank | Domain | Search Visibility Share |
|---|---|---|
| 1 | Grabon | 71.13% |
| 2 | Desidime | 8.07% |
| 3 | Worthepenny | 6.62% |
| 4 | Couponfollow | 4.00% |
| 5 | Simplycodes | 3.57% |
| 6 | Coupondunia | 1.88% |
| 7 | Coupon.today | 1.53% |
| 8 | Savee | 1.09% |
| 9 | Couponzguru | 1.03% |
| 10 | Zoutons. | 0.45% |
| 11 | Couponmoto | 0.41% |
| 12 | Cashkaro | 0.21% |
| Total | 100.00% |
How India Hunts for Savings
The eight sections that follow are drawn from GrabOn’s proprietary dataset of approximately 24 million coupon interactions on GrabOn IN between 1 July 2025 and 30 June 2026. All figures are published as indices or shares; absolute click volumes are withheld by design. Full methodology appears at the end of this report.
Sections 06 – 13 · GrabOn proprietary dataSection 06 / 16
The Indian Savings Calendar
Summer, not the festive season, is peak deal-hunting in India.
April and May outpull the October to December festive quarter by around 13% on daily coupon demand, driven by summer sales, IPL evenings and quick-commerce stocking. May (111) narrowly edges September (110) as the single busiest month, and February is the quietest of the year (85).
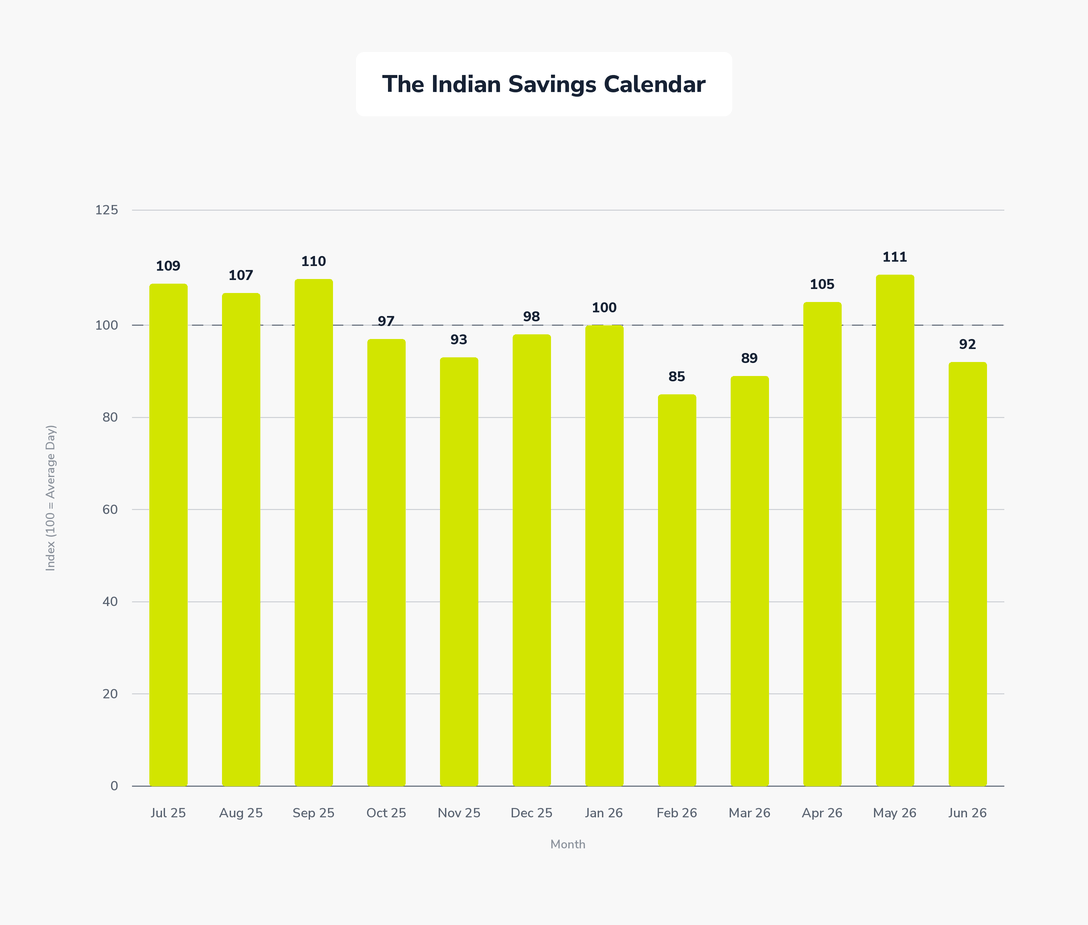
The finding overturns the industry’s default assumption that the Diwali quarter is the year’s discount high point. Festive commerce concentrates spend, but summer concentrates hunting: household stocking ahead of the heat, IPL-evening food and OTT orders, and the summer sale waves of the major marketplaces together produce a longer, flatter peak than the festive spike. For merchants, the practical implication is to budget offer inventory and affiliate spend for April and May with the same seriousness as for the festive quarter, or cede those months to competitors who do.
Each bar is that month’s average daily clicks against the site’s average day (=100), adjusted for month length. Absolute clicks withheld by design. The summer-over-festive finding was verified within a constant-visibility window (November 2025 to June 2026) and corroborated independently by impressions, which show the same pattern.
Section 07 / 16
The Ten Days India Hunted Hardest in 2025
Cricket, not commerce, produced the single biggest deal-hunting day of the year.
India vs Pakistan at the Asia Cup on 14 September 2025 out-pulled every sale-event launch day, running at 134% of a normal day. Of the ten heaviest days of the year, three are cricket-linked, and the rest map cleanly to sale-event launches and national holidays. The pattern is consistent: deal-hunting spikes when the whole country is at home with a screen in hand.
Event attribution for spike days from public sale calendars and sports schedules. Index base: median day of the study period = 100.
| Date | Index (median day = 100) | What happened |
|---|---|---|
| 14 Sep 2025 | 134 | India vs Pakistan, Asia Cup group match; a Sunday the whole country stayed in and ordered in |
| 17 May 2026 | 133 | Summer sale weekend (Flipkart Sasa Lele wave) and an IPL league Sunday double-header |
| 22 Sep 2025 | 129 | Navratri Day 1 plus Big Billion Days / Great Indian Festival early access for Plus, Black and Prime members |
| 02 Aug 2025 | 129 | First weekend of the Independence Day sale season (Amazon Great Freedom Festival window) |
| 12 Jul 2025 | 128 | Amazon Prime Day 2025 opening day (12 to 14 July), first-ever 3-day edition in India |
| 09 May 2026 | 127 | Flipkart Sasa Lele Summer Sale opened to all users; Mother’s Day gifting eve |
| 23 Sep 2025 | 127 | Big Billion Days and Great Indian Festival opened to all users on the same day |
| 15 Aug 2025 | 127 | Independence Day; Freedom sales at full tilt on a national holiday |
| 16 May 2026 | 126 | Summer sale Saturday plus IPL league-stage weekend |
| 28 Sep 2025 | 125 | India vs Pakistan Asia Cup final plus the closing weekend of the festive sales’ first leg |
22 September 2025 deserves a second look: it combined Navratri Day 1, festive early access and the rollout of GST 2.0 rate cuts, stacking policy savings on top of platform discounts. Days when multiple savings triggers coincide consistently outperform days with a single trigger, however large.
Section 08 / 16
The Payday Effect
Salary day is visible in the data.
Days 1, 2 and 14 of the month run about 4% hot; the lean stretch from the 19th to the 27th runs 2 to 4% cold. The 31st spikes to 107 as month-end offers expire.
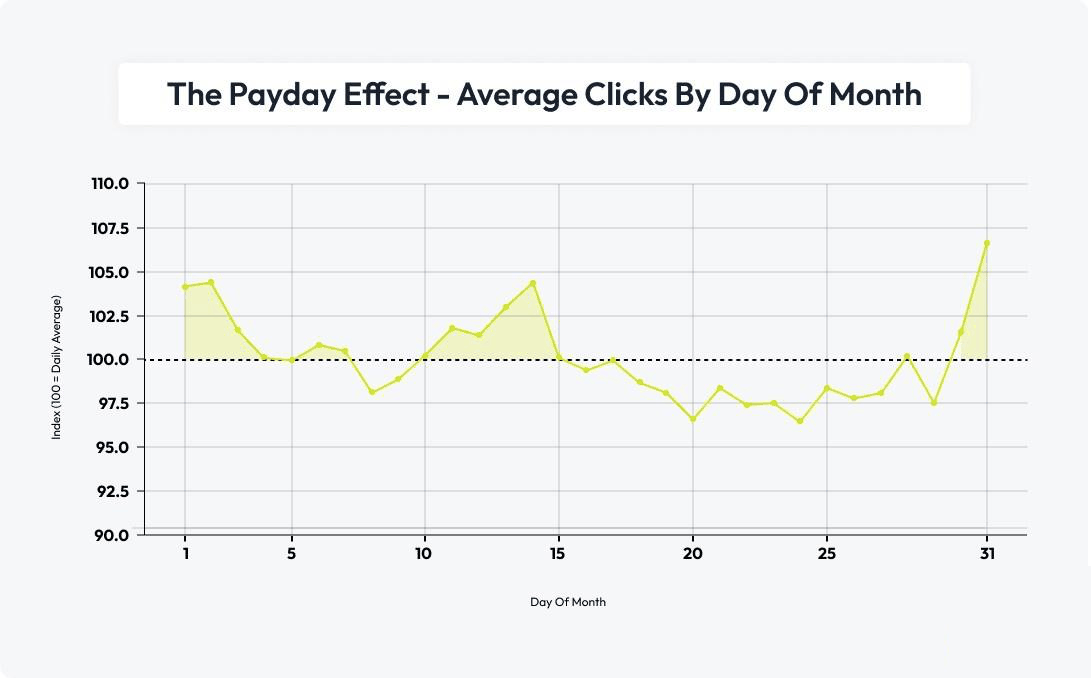
The curve is a clean read-out of India’s salary cycle. Liquidity arrives on the 1st and, for a large cohort, mid-month around the 14th; discretionary purchases and the coupon searches that precede them follow within 48 hours. The late-month trough is equally instructive: shoppers do not stop wanting to buy between the 19th and 27th, they postpone, and the 31st spike shows them returning the moment expiring offers create urgency. For offer scheduling, the first three days and the mid-month window are the highest-yield slots for launching codes; end-of-month is the natural window for expiry-led messaging.
Index 100 = daily average across the study period. Day-of-month averages computed across all twelve months, July 2025 to June 2026.
Section 09 / 16
The Run-Up to Diwali
The Diwali deal-hunt happens a month before Diwali, not at Diwali.
Coupon demand peaked in the festive-sale launch window in late September, at up to 117% of the September baseline, then fell steadily as carts were locked in, bottoming at 70% on Diwali day itself, when India stopped shopping and started celebrating. The hunt precedes the festival by roughly four weeks; by Diwali week the deals are already claimed.
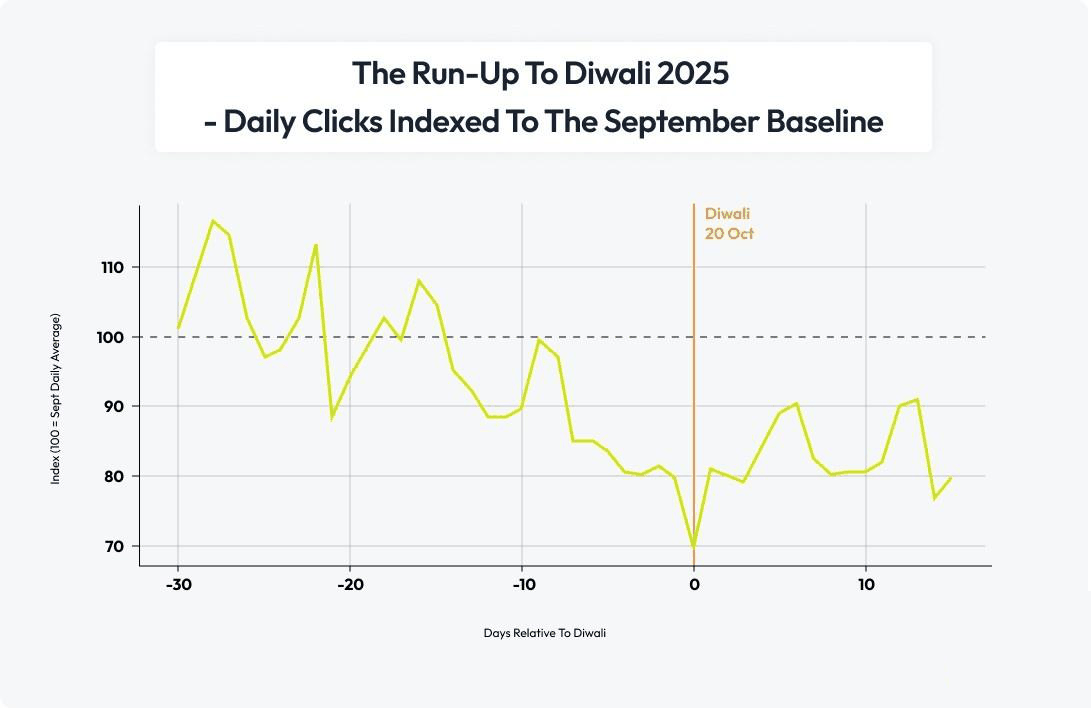
The practical consequence for brands is that Diwali-week discount campaigns arrive after the decision has been made. The battle for the festive wallet is fought and won in the last week of September, when early-access windows open and shoppers comparison-hunt most intensively. Section 10 quantifies just how much money moves through that window.
Diwali (Lakshmi Puja) taken as 20 October 2025 per Drik Panchang; the Amavasya tithi spanned 20 to 21 October. Index 100 = September daily average.
Section 10 / 16
The Festive Economy: India’s Biggest Discount Stage
India’s festive-season e-commerce crossed Rs. 1.15 lakh crore ($13.12 billion) in GMV in 2025, growing 20 to 25% year on year, the strongest festive season in five years.
Redseer’s tracking shows the first 11 days alone, beginning 22 September, clocked more than Rs. 60,000 crore in GMV, roughly 3.5 times business-as-usual levels, with about 90 million shoppers participating at an average spend of close to Rs. 7,000 per shopper. Flipkart led the opening week with a 48% GMV share, followed by Amazon at 32%.
| Festive 2025 indicator | Value |
|---|---|
| Total festive e-commerce GMV | Rs. 1.15+ lakh crore ($13.12 billion) |
| Year-on-year growth | 20 to 25% (vs 12% in 2024) |
| First-11-day GMV (from 22 Sep) | Rs. 60,000+ crore (3.5x business as usual) |
| Shoppers in first 11 days | 90 million |
| Average spend per shopper | Rs. 7,000 |
| Share of shoppers from tier-2+ cities | 60 to 65% |
| Quick commerce festive growth | 150% YoY |
| Value commerce festive growth | 40 to 50% YoY |
Three points connect this to coupon behaviour. First, the geography matches: 60 to 65% of festive shoppers came from tier-2 and beyond, the same non-metro cohort driving shopper-base growth in Section 3. Second, the timing matches: the GMV surge is concentrated in exactly the late-September launch window where Section 9 shows coupon demand peaking, confirming that discount discovery leads spend rather than following it. Third, the fastest-growing formats, quick commerce at roughly 150% and value commerce at 40 to 50%, are both savings-led propositions, which suggests the festive economy is becoming more discount-sensitive, not less, as it scales.
Source: Redseer Strategy Consultants, Festive Season 2025 reports (August to November 2025); IBEF; Storyboard18 citing Redseer platform-share data.
Section 11 / 16
What India Discounts Most
The needs of daily life, travel, food delivery, fashion and grocery, account for over 55% of India’s coupon demand.
The distribution dismantles a durable stereotype. Electronics, the category most associated with deal-hunting in the popular imagination, attracts under 3% of coupon demand; big-ticket electronics purchases are infrequent, planned and increasingly financed through bank offers rather than codes. The categories where India actually hunts are high-frequency and habitual: a traveller books monthly, a food-delivery user orders weekly, a grocery shopper restocks continuously. Travel alone attracts nearly 13 times the coupon demand of education. Coupon usage in India is not an occasional big-purchase behaviour; it is a recurring line item in the household’s monthly budget.
Method: category clicks divided by total classified clicks, using a 12-category merchant taxonomy covering approximately 85% of page clicks. No raw click volumes or merchant names are published.
| Category | Share of coupon demand |
|---|---|
| Travel | 15.4% |
| Food Delivery | 14.3% |
| Fashion | 13.4% |
| Grocery | 12.2% |
| Entertainment / OTT | 11.1% |
| eCommerce (General) | 11.1% |
| Services / Utility | 6.5% |
| Beauty | 4.9% |
| Health / Pharma | 4.5% |
| Electronics | 2.9% |
| Fintech | 2.6% |
| Education | 1.2% |
Section 12 / 16
Every Category Has Its Season
India now shops on two calendars. Everyday categories peak in the summer; marketplace and streaming peak with the festive sales. The table below shows when each category peaks and how far that peak sits above its own typical month.
| Category | Peak month | Peak vs a typical month | What drives it |
|---|---|---|---|
| Grocery | May | +44% | Quick-commerce summer stocking at its height, the sharpest spike of any everyday category |
| Food delivery | May | +25% | IPL evenings call for more food deliveries |
| Fashion | May | +25% | Summer-sale wardrobe refresh, with a second wave at the festive sales |
| Travel | August | +16% | Festive and year-end trips booked early, in the late monsoon |
| Entertainment / OTT | September | +45% | OTT deals ride the pre-festive push, the steepest festive spike in the study |
| eCommerce (general) | September | +29% | Locked to Big Billion Days and the Great Indian Festival, which open before the festival season proper |
Each figure compares a category with its own average month, not with other categories. A higher number means a sharper peak against that category’s own baseline, not more demand overall. Grocery at +44% is the spikiest everyday category; it is not larger than eCommerce.
Read down the table and two clusters appear. Groceries, food delivery and fashion all peak in May, in the hottest weeks of the year, when quick-commerce stocking, IPL season and the summer wardrobe refresh land together. This is the everyday-spend calendar, and these are the categories that drive most coupon demand.
The festive quarter belongs to a different set. General eCommerce and OTT peak in September, tied to the big marketplace sale events rather than the festival dates themselves. Travel peaks a little earlier, in August, as festive and year-end trips get booked ahead. Fashion is the only category on both calendars, with its main peak in May and a second wave in the festive sales.
The takeaway for savings is simple: the calendar has to be read category by category, not quarter by quarter. A single national promotion calendar, built around the festive season, now misses at least half of what shoppers are actually trying to save on.
Section 13 / 16
How India Reaches a Discount
Coupon hunting in India is a phone-first ritual. Nearly 85 of every 100 coupon searches happen on a mobile.
| Device | Share of coupon searches |
|---|---|
| Mobile | 84.6% |
| Desktop | 14.7% |
| Tablet | 0.7% |
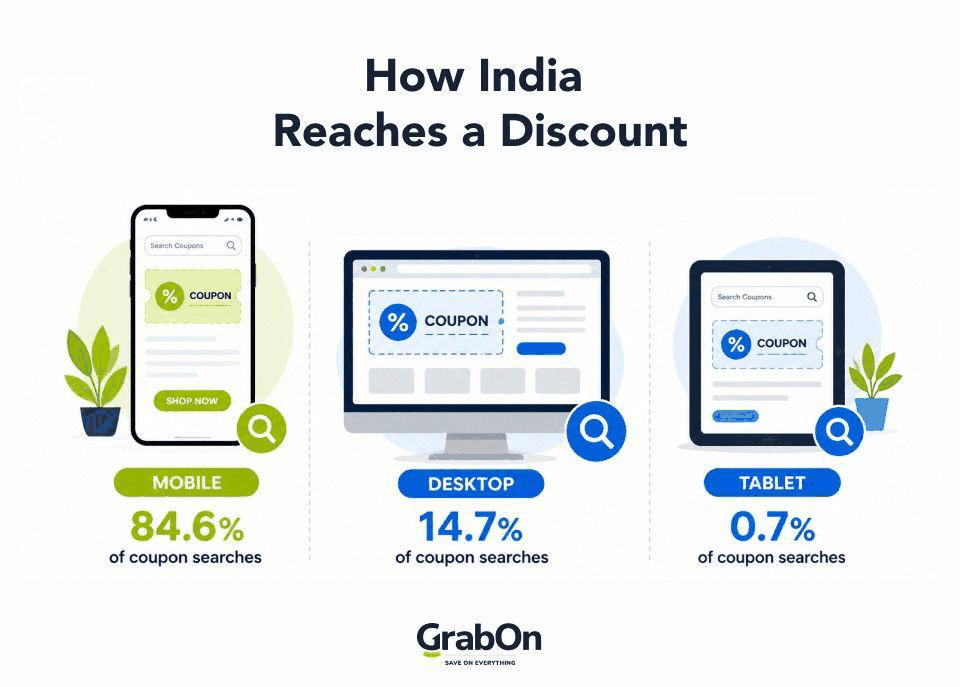
The device split mirrors the infrastructure underneath it. As of 2026, 690 million Indians use smartphones and 85.5% of households possess at least one, so for most of the country the phone is not a channel among several; it is the only screen in the purchase journey. Desktop’s 14.7% is concentrated in office-hours hunting and higher-value comparison purchases; the tablet is statistically irrelevant. Every element of the savings experience, from code display to one-tap copy to checkout hand-off, is now designed for a device held in one hand.
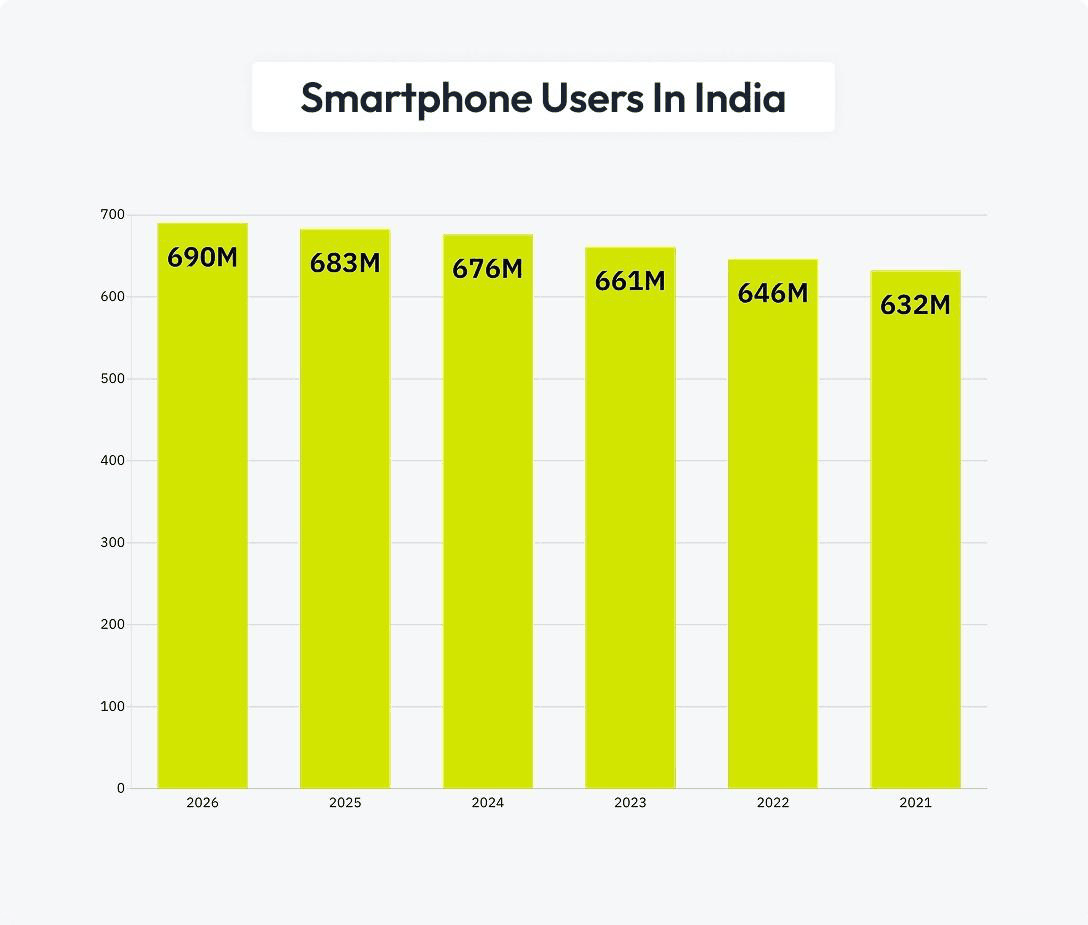
| Year | Smartphone users in India |
|---|---|
| 2026 | 690 million |
| 2025 | 683 million |
| 2024 | 676 million |
| 2023 | 661 million |
| 2022 | 646 million |
| 2021 | 632 million |
Supplementary data: smartphone user base and household penetration from industry estimates compiled by GrabOn. Device split of coupon searches: Google Search Console data for grabon.in, July 2025 to June 2026.
What’s Still To Come
The headroom, the habit and the friction: how many Indians are yet to start shopping online, how often the ones who do go looking for a code, and how much of that hunting time is wasted.
Sections 14 – 16 · Outlook & shopper surveySection 14 / 16
India’s Coupon Demand Is Yet to Peak
As of 2026, 690 million Indians use smartphones, yet only 342 million shop online actively. That leaves roughly 348 million connected Indians, more than half of the smartphone base, who hold the primary gateway to e-commerce in their hands but have not yet become active online shoppers.
This is not a saturated market. It is a market that is barely half converted.
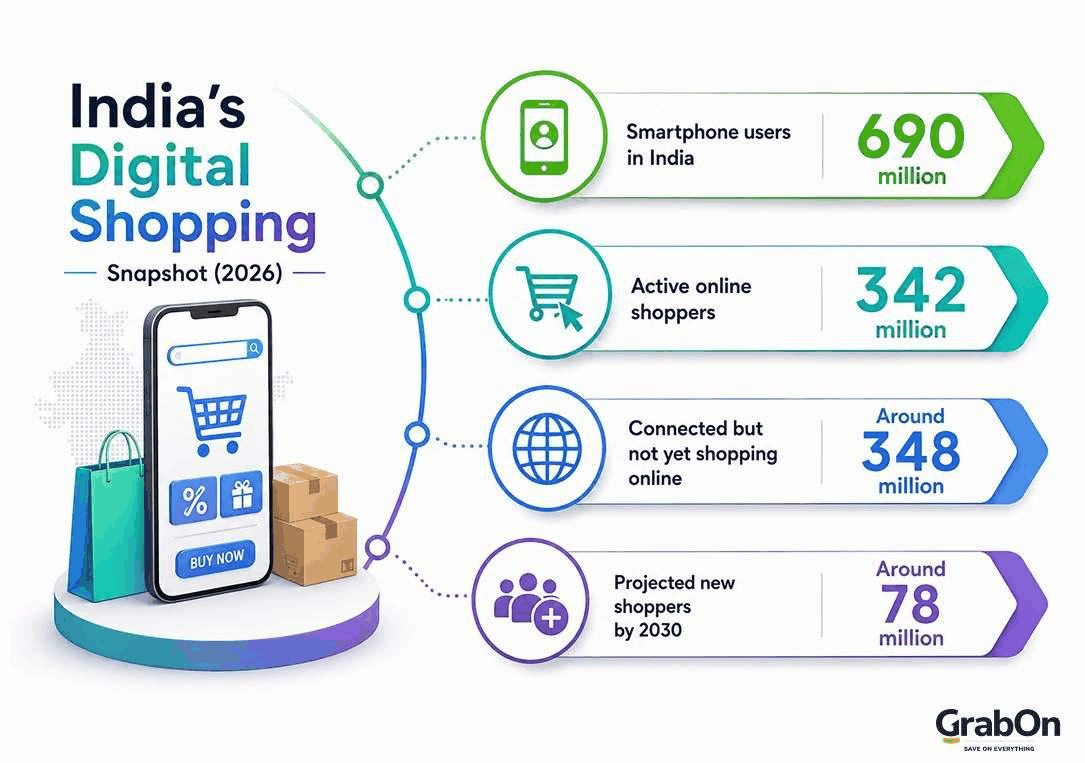
| Metric (2026) | Figure |
|---|---|
| Smartphone users in India | 690 million |
| Active online shoppers | 342 million |
| Connected but not yet shopping online | Around 348 million |
| Projected new shoppers by 2030 | Around 78 million |
Why does this matter for coupon usage? Because first-time and early-stage online shoppers are the most price-sensitive segment of the funnel. For a household making its first online purchase, a discount code is rarely a bonus; it is often the deciding factor that tips the purchase from offline to online. Every wave of new shoppers entering the market arrives more deal-conscious than the established base, not less.
The trajectory of the last three years supports this. India added 80 million digital shoppers since 2022, and the majority of this growth came from Tier 2 and Tier 3 cities, where value-seeking behaviour is strongest. As the shopper base climbs towards the projected 420 million by 2030, the incoming 78 million shoppers will be drawn disproportionately from these price-conscious segments.
The implication is direct: coupon demand in India is not tied to today’s 342 million shoppers. It is tied to the 690 million who are already connected. The shopper base will grow into the smartphone base, and coupon-seeking behaviour will grow ahead of it, because discounts are the on-ramp, not the afterthought.
Section 15 / 16
When Do Indian Shoppers Look for Coupons?
Three in ten shoppers search for coupon codes before they complete an online purchase, and nearly a fourth (29%) look for a chance to save almost every time they add an item to their cart.
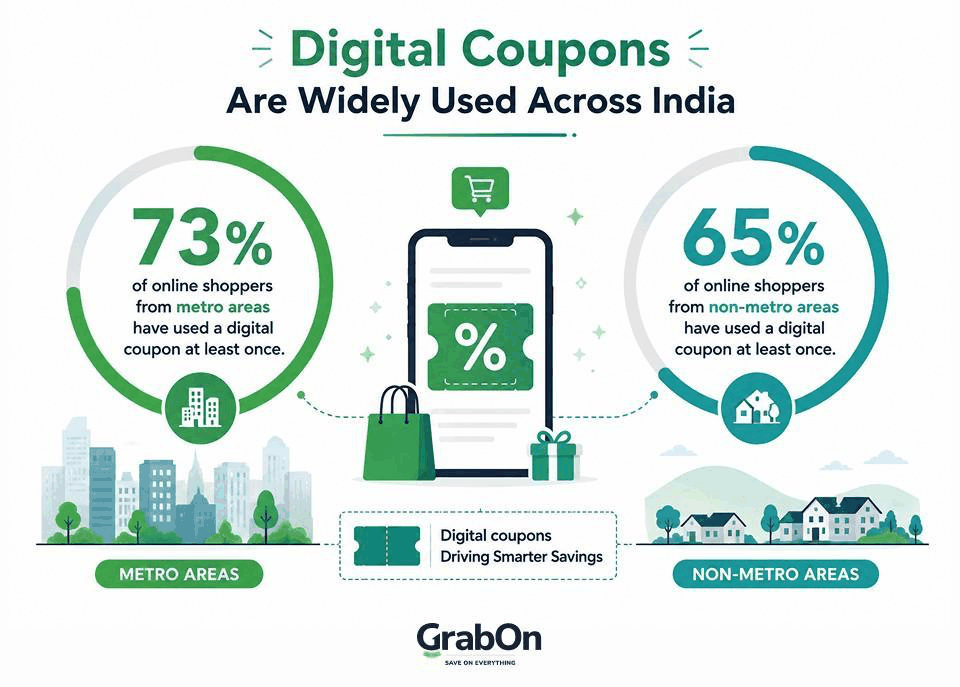
Roughly half of surveyed shoppers said they hunt for codes for at least half of their purchases. Adoption is broad: 73% of online shoppers from metro areas and 65% of non-metro shoppers have used a digital coupon at least once. In other words, if shoppers from both metro and non-metro areas are presented with more discount coupons upfront, they are more likely to use them than if they must search for coupons and discounts themselves.
| Segment | Always search for a code |
|---|---|
| Metro men | 35% |
| Metro women | 31% |
| Non-metro women | 28% |
| Non-metro men | 22% |
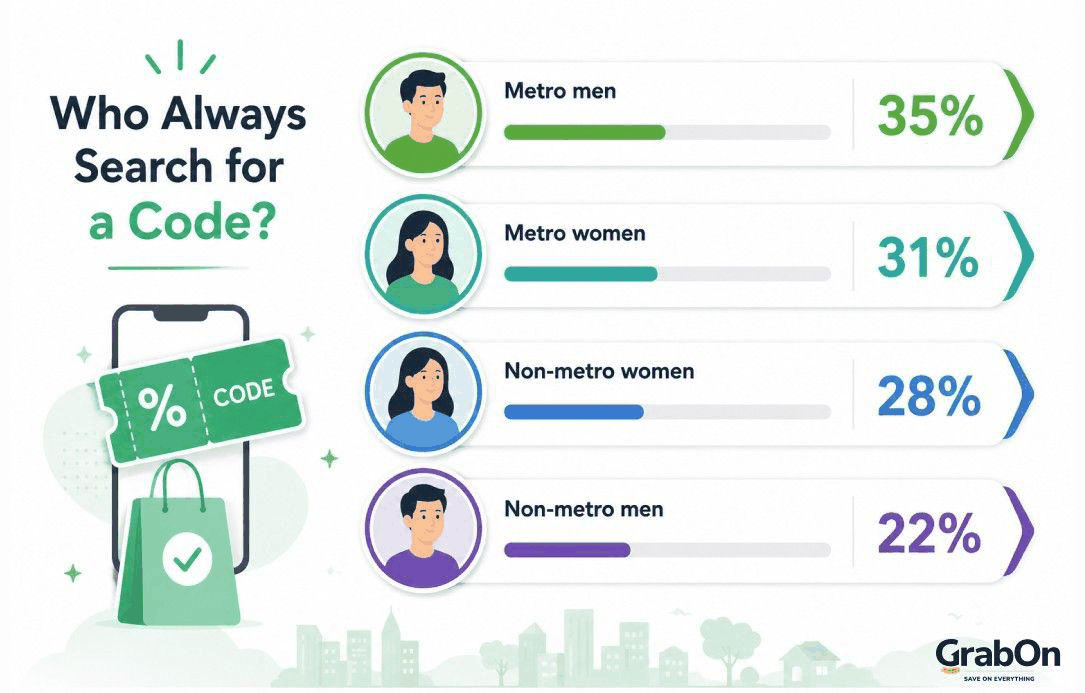
The demographic detail is where it gets interesting. Among metro and non-metro women, discount codes are hunted at similar rates: 31% and 28% respectively always search for a code. Among men the gap widens sharply: 35% of metro men always look for coupons, against 22% of their non-metro counterparts. Non-metro shoppers overall are less likely than metro shoppers to always search for discount codes, a gap that narrows as coupon platforms localise and non-metro shopping frequency rises.
Source: Shopper.com, representative survey of Indian online shoppers aged 18 to 64.
Section 16 / 16
The Cost of the Hunt: Time Spent on Unsuccessful Coupon Searching
Metro shoppers spend around 6 hours a year hunting for coupons; non-metro shoppers around 4.5 hours. Based on self-reported success rates, half of that time is wasted.
Coupon hunting is something shoppers, no matter where they live, detest with a common rage. Around 60% of shoppers use discount codes for at least half of their online purchases, and a third open a new tab to search for codes almost every time, yet that does not mean they are happy with the work it takes. An average metro shopper searches for coupons every 6 hours of shopping activity, compared with every 4.5 hours for non-metro shoppers, and both spend roughly the same amount of time per session (about 30 and 22 minutes respectively), which works out to around seven minutes per week.
Half of the time shoppers spend looking for online savings is wasted, as they are unable to find a code that saves them money at checkout. When products are in the cart and the shopper is ready to pay, hunting through dead codes is precisely the friction that abandons carts. Not everyone struggles equally: men are about twice as likely as women to say they rarely or never fail to find a working coupon, and experienced super shoppers are over three times more likely than regular shoppers to say the same, a skill effect built through practice. The industry implication is blunt: code verification, not code volume, is the product. Almost all surveyed shoppers said they would consider alternative options instead of manually searching for discount coupons, which is the demand signal behind verified coupon platforms and auto-apply tools.
Source: Shopper.com survey; time-use figures as reported by respondents.
Methodology and Sources of Data in This Report
Proprietary data
Grabon’s GSC Data from 1 July 2025 to 30 June 2026. Monthly and daily indices computed against period averages; category classification via a 12-category merchant taxonomy covering approximately 85% of page clicks; query-intent shares via regex groups against total clicks (the total includes anonymised queries, so shares are conservative); device and country splits taken directly from Search Console. Diwali date: 20 October 2025 per Drik Panchang. Event attribution for spike days from public sale calendars and sports schedules. Absolute click volumes are withheld throughout; all published figures are indices or shares.
Secondary sources
- Business Research Insights: global digital coupons market size and forecast.
- India Brand Equity Foundation (IBEF): Indian e-commerce market size, online retail share of total retail, rural and urban online shopper CAGRs, UPI August 2025 performance.
- IAMAI-Kantar, Internet in India Report 2024: active internet users and rural share.
- ResearchAndMarkets, India Cashback Programs Market Databook 2024: cashback spending forecast and CAGR.
- Indian Startup News (August 2025): CashKaro FY25 results.
- Redseer Strategy Consultants: festive season 2025 GMV, growth, shopper counts, spend, tier and format splits; platform shares via Storyboard18.
- Shopper.com: Indian coupon-usage survey, adoption rates, time-use and success-rate findings.
- Government of India / News on Air, GST Council decisions, Deccan Herald, Business Standard: GST 2.0 structure, savings and revenue estimates.
- Central Consumer Protection Authority and LocalCircles: dark pattern guidelines and audit findings; Medianama and The Logical Indian for the annual cost estimate.
GrabOn calculations
The 3.2x global market multiple, the 18.4% India e-commerce CAGR from FY2024 to FY2030, the 19.5 million per year net shopper additions to 2030, the 55%+ daily-life category share and the travel-to-education ratio are derived arithmetically from the cited figures in their respective sections. All derived figures are labelled as GrabOn calculations at the point of use.
This report is published for general information. Third-party figures remain the property of their respective publishers and are cited under fair-dealing principles for reporting and review. Figures marked as forecasts are projections, not guarantees.
Summarize This Report With AI
Open this report in your preferred assistant and get a short summary of the findings.


Opens in a new tab. The summary is generated by the tool you choose, not by GrabOn.